GBP/USD: the instrument is consolidating
27 June 2019, 09:50
| Scenario | |
|---|---|
| Timeframe | Intraday |
| Recommendation | BUY STOP |
| Entry Point | 1.2710 |
| Take Profit | 1.2782, 1.2800, 1.2829 |
| Stop Loss | 1.2660 |
| Key Levels | 1.2557, 1.2600, 1.2640, 1.2659, 1.2705, 1.2746, 1.2782, 1.2829 |
| Alternative scenario | |
|---|---|
| Recommendation | SELL STOP |
| Entry Point | 1.2650 |
| Take Profit | 1.2557 |
| Stop Loss | 1.2705 |
| Key Levels | 1.2557, 1.2600, 1.2640, 1.2659, 1.2705, 1.2746, 1.2782, 1.2829 |
Current trend
The British currency showed a slight increase against the US dollar on June 26, partially compensating a steady decline the previous day. There were no noticeable reasons for the pound strengthening, so the growth was largely technical. Investors were focused on the speech of the head of the Bank of England, Mark Carney. He noted that recently the risks associated with the "tough" Brexit scenario have increased significantly. At the moment, the regulator's forecasts do not take this scenario into account, so they can be revised as the next Brexit deadline approaches. Published macroeconomic statistics from the UK had no significant support for the pound. The number of approved mortgage loans from BBA in June decreased from 42.898K to 42.384K, which was worse than the average market expectations.
Support and resistance
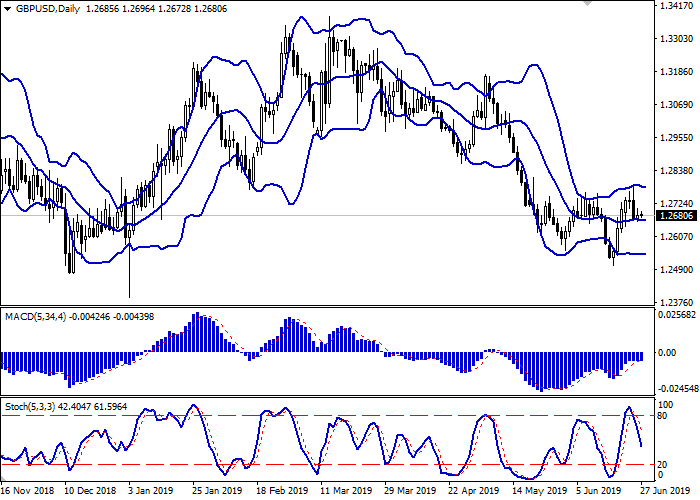
Bollinger Bands in D1 chart demonstrate flat dynamics. The price range narrows slightly from above, reflecting the appearance of a "bearish" dynamics at the beginning of the week. MACD is trying to reverse down, but still retains its buy signal (the histogram is above the signal line). Stochastic demonstrates a steady decline and practically does not react to the appearance of ambiguous dynamics on Wednesday.
To open new short positions, one should wait for the appearance of the "bearish" signals from MACD indicator. One should also watch the testing of the breakdown of the midline of Bollinger Bands.
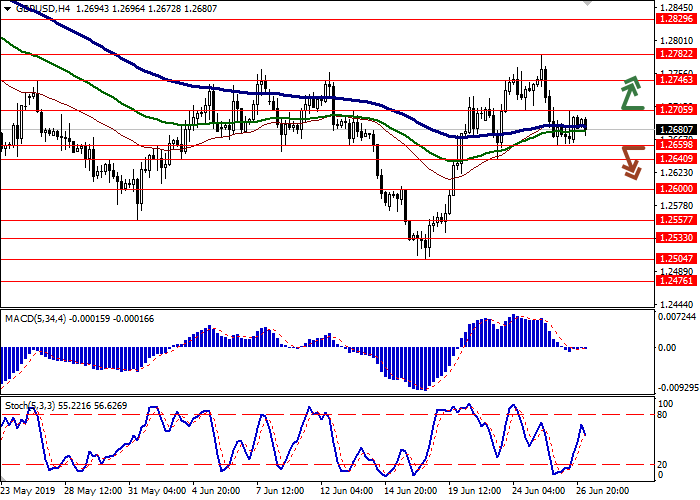
Resistance levels: 1.2705, 1.2746, 1.2782, 1.2829.
Support levels: 1.2659, 1.2640, 1.2600, 1.2557.


Trading tips
To open long positions, one can rely on the breakout of 1.2705. Take profit – 1.2782–1.2800 or 1.2829. Stop loss – 1.2660.
The return of "bearish" dynamics with the breakdown of 1.2659 may become a signal to start sales with the target at 1.2557. Stop loss – 1.2705.
Implementation period: 2-3 days.
The British currency showed a slight increase against the US dollar on June 26, partially compensating a steady decline the previous day. There were no noticeable reasons for the pound strengthening, so the growth was largely technical. Investors were focused on the speech of the head of the Bank of England, Mark Carney. He noted that recently the risks associated with the "tough" Brexit scenario have increased significantly. At the moment, the regulator's forecasts do not take this scenario into account, so they can be revised as the next Brexit deadline approaches. Published macroeconomic statistics from the UK had no significant support for the pound. The number of approved mortgage loans from BBA in June decreased from 42.898K to 42.384K, which was worse than the average market expectations.
Support and resistance
Bollinger Bands in D1 chart demonstrate flat dynamics. The price range narrows slightly from above, reflecting the appearance of a "bearish" dynamics at the beginning of the week. MACD is trying to reverse down, but still retains its buy signal (the histogram is above the signal line). Stochastic demonstrates a steady decline and practically does not react to the appearance of ambiguous dynamics on Wednesday.
To open new short positions, one should wait for the appearance of the "bearish" signals from MACD indicator. One should also watch the testing of the breakdown of the midline of Bollinger Bands.
Resistance levels: 1.2705, 1.2746, 1.2782, 1.2829.
Support levels: 1.2659, 1.2640, 1.2600, 1.2557.


Trading tips
To open long positions, one can rely on the breakout of 1.2705. Take profit – 1.2782–1.2800 or 1.2829. Stop loss – 1.2660.
The return of "bearish" dynamics with the breakdown of 1.2659 may become a signal to start sales with the target at 1.2557. Stop loss – 1.2705.
Implementation period: 2-3 days.


No comments:
Write comments