USD/CAD: the dollar remains under pressure
27 June 2019, 09:48
| Scenario | |
|---|---|
| Timeframe | Intraday |
| Recommendation | BUY STOP |
| Entry Point | 1.3155, 1.3185 |
| Take Profit | 1.3283, 1.3320 |
| Stop Loss | 1.3130, 1.3100 |
| Key Levels | 1.3000, 1.3067, 1.3100, 1.3149, 1.3200, 1.3228, 1.3283 |
| Alternative scenario | |
|---|---|
| Recommendation | SELL STOP |
| Entry Point | 1.3095 |
| Take Profit | 1.3000 |
| Stop Loss | 1.3149 |
| Key Levels | 1.3000, 1.3067, 1.3100, 1.3149, 1.3200, 1.3228, 1.3283 |
Current trend
Yesterday, USD fell steadily against CAD, renewing its lows since February 5. The development of the negative dynamics of the instrument was due to poor positions of USD against the background of an uncertain macroeconomic background and threats to reduce the interest rate of the Fed. The instrument is supported by optimistic prospects for resolving the trade conflict between the United States and China. Investors are looking forward to Donald Trump and Xi Jinping meeting within the G20 summit, which will be held in Japan later this week.
Today, during the Asian session, the pair is growing slightly, being corrected before the summit. On Thursday, the investors will focus on annual data on Q1 US GDP. In addition, traders are interested in data on the dynamics of pending home sales in May.
Support and resistance
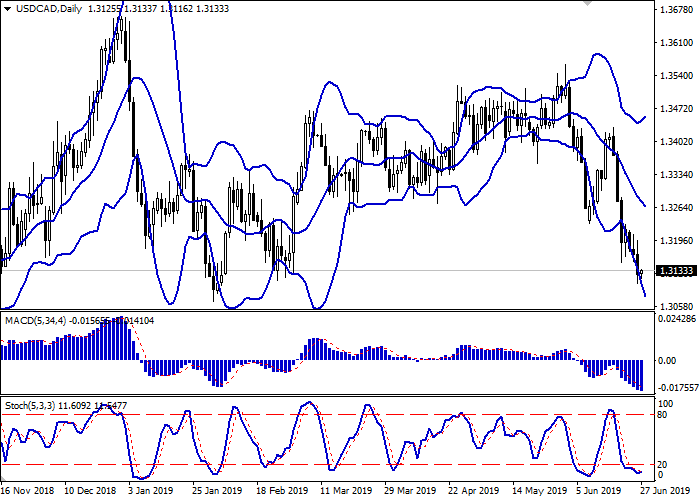
On the daily chart, Bollinger bands steadily decline. The price range actively expands from above, remaining overly spacious for the current level of activity. The MACD falls, keeping a poor sell signal (the histogram is below the signal line). Stochastic approaches its lows and is ready to reverse upwards, signaling that USD is strongly oversold in the super short term.
The emergence of corrective growth is possible in the nearest time intervals.
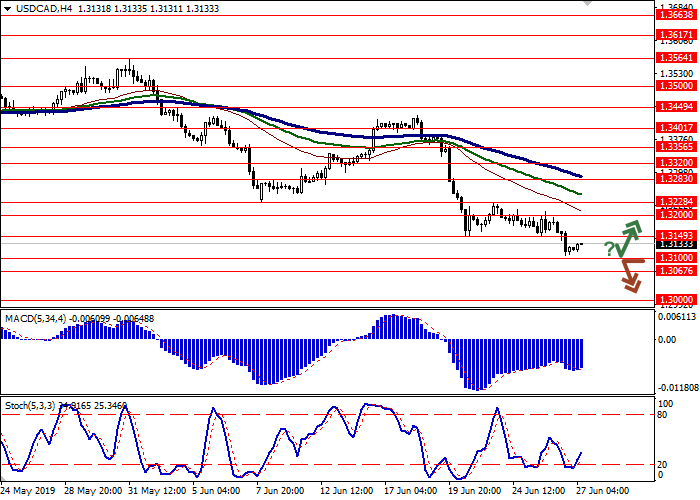
Resistance levels: 1.3149, 1.3200, 1.3228, 1.3283.
Support levels: 1.3100, 1.3067, 1.3000.


Trading tips
Long positions can be opened after a rebound from 1.3100 and the breakout of 1.3149–1.3180 with the target at 1.3283 or 1.3320. Stop loss is 1.3130–1.3100. Implementation period: 2–3 days.
Short positions can be opened after the breakdown of 1.3100 with the target at 1.3000. Stop loss is 1.3149. Implementation period: 1–2 days.
Yesterday, USD fell steadily against CAD, renewing its lows since February 5. The development of the negative dynamics of the instrument was due to poor positions of USD against the background of an uncertain macroeconomic background and threats to reduce the interest rate of the Fed. The instrument is supported by optimistic prospects for resolving the trade conflict between the United States and China. Investors are looking forward to Donald Trump and Xi Jinping meeting within the G20 summit, which will be held in Japan later this week.
Today, during the Asian session, the pair is growing slightly, being corrected before the summit. On Thursday, the investors will focus on annual data on Q1 US GDP. In addition, traders are interested in data on the dynamics of pending home sales in May.
Support and resistance
On the daily chart, Bollinger bands steadily decline. The price range actively expands from above, remaining overly spacious for the current level of activity. The MACD falls, keeping a poor sell signal (the histogram is below the signal line). Stochastic approaches its lows and is ready to reverse upwards, signaling that USD is strongly oversold in the super short term.
The emergence of corrective growth is possible in the nearest time intervals.
Resistance levels: 1.3149, 1.3200, 1.3228, 1.3283.
Support levels: 1.3100, 1.3067, 1.3000.


Trading tips
Long positions can be opened after a rebound from 1.3100 and the breakout of 1.3149–1.3180 with the target at 1.3283 or 1.3320. Stop loss is 1.3130–1.3100. Implementation period: 2–3 days.
Short positions can be opened after the breakdown of 1.3100 with the target at 1.3000. Stop loss is 1.3149. Implementation period: 1–2 days.


No comments:
Write comments