USD/CHF: the dollar is steadily declining
04 June 2019, 10:16
| Scenario | |
|---|---|
| Timeframe | Intraday |
| Recommendation | BUY STOP |
| Entry Point | 0.9960 |
| Take Profit | 1.0020, 1.0047 |
| Stop Loss | 0.9920 |
| Key Levels | 0.9871, 0.9893, 0.9909, 0.9952, 0.9976, 1.0000, 1.0020 |
| Alternative scenario | |
|---|---|
| Recommendation | SELL STOP |
| Entry Point | 0.9900 |
| Take Profit | 0.9850, 0.9830 |
| Stop Loss | 0.9940, 0.9950 |
| Key Levels | 0.9871, 0.9893, 0.9909, 0.9952, 0.9976, 1.0000, 1.0020 |
Current trend
Yesterday, USD fell sharply against CHF, renewing lows since March 27. The reason for the further weakening of USD was the poor macroeconomic statistics on US business activity, which revived concerns about a possible recession in the country's economy again. In turn, the statistics from Switzerland was very optimistic. Thus, the business activity index from SVME in May rose from 48.5 to 48.6 points. The consumer price index in Switzerland for the same period rose by 0.3% MoM, which was 0.1% better than analysts' expectations. In annual terms, the growth of inflation slowed slightly from +0.7% YoY to +0.6% YoY.
Support and resistance
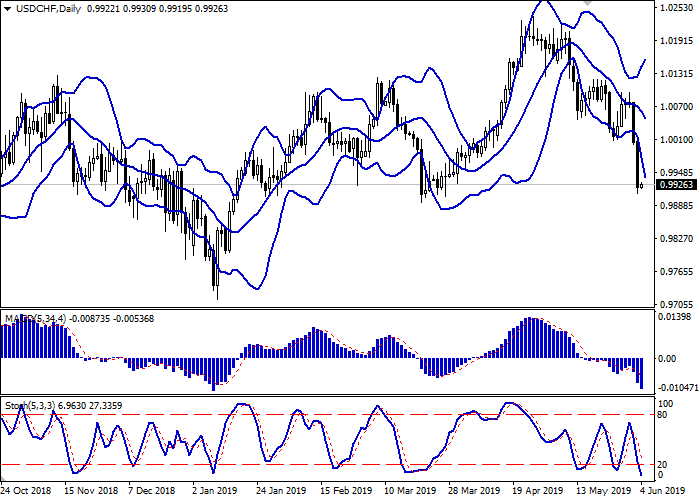
On the daily chart, Bollinger bands are steadily declining. The price range is expanding but not as fast as the "bearish" moods develop. The MACD indicator is falling, keeping a strong sell signal (the histogram is below the signal line). Stochastic keeps downward direction but indicates that USD is strongly oversold in the super short term.
To open new trading positions, it is better to wait for the appearance of new signals from technical indicators.
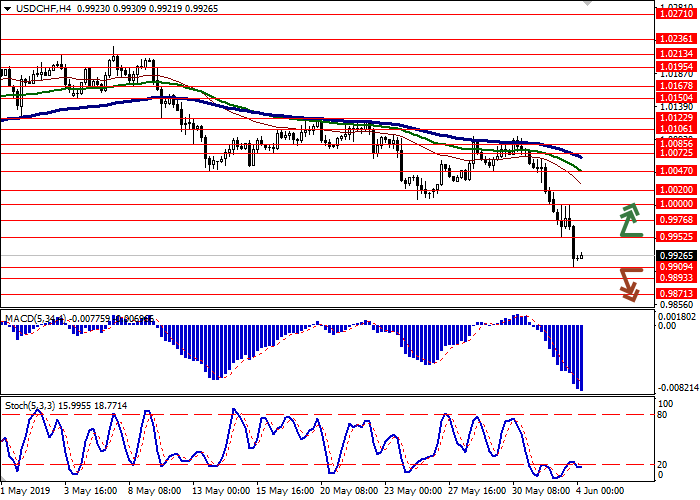
Resistance levels: 0.9952, 0.9976, 1.0000, 1.0020.
Support levels: 0.9909, 0.9893, 0.9871.


Trading tips
Long positions can be opened after the breakout of the level of 0.9952 with the target at 1.0020 or 1.0047. Stop loss is 0.9920.
Short positions can be opened after the breakdown of the level of 0.9909 with the target at 0.9850 or 0.9830. Stop loss is 0.9940–0.9950.
Implementation period: 2–3 days.
Yesterday, USD fell sharply against CHF, renewing lows since March 27. The reason for the further weakening of USD was the poor macroeconomic statistics on US business activity, which revived concerns about a possible recession in the country's economy again. In turn, the statistics from Switzerland was very optimistic. Thus, the business activity index from SVME in May rose from 48.5 to 48.6 points. The consumer price index in Switzerland for the same period rose by 0.3% MoM, which was 0.1% better than analysts' expectations. In annual terms, the growth of inflation slowed slightly from +0.7% YoY to +0.6% YoY.
Support and resistance
On the daily chart, Bollinger bands are steadily declining. The price range is expanding but not as fast as the "bearish" moods develop. The MACD indicator is falling, keeping a strong sell signal (the histogram is below the signal line). Stochastic keeps downward direction but indicates that USD is strongly oversold in the super short term.
To open new trading positions, it is better to wait for the appearance of new signals from technical indicators.
Resistance levels: 0.9952, 0.9976, 1.0000, 1.0020.
Support levels: 0.9909, 0.9893, 0.9871.


Trading tips
Long positions can be opened after the breakout of the level of 0.9952 with the target at 1.0020 or 1.0047. Stop loss is 0.9920.
Short positions can be opened after the breakdown of the level of 0.9909 with the target at 0.9850 or 0.9830. Stop loss is 0.9940–0.9950.
Implementation period: 2–3 days.


No comments:
Write comments