Brent Crude Oil: oil prices are going down
04 June 2019, 10:17
| Scenario | |
|---|---|
| Timeframe | Intraday |
| Recommendation | BUY STOP |
| Entry Point | 63.15 |
| Take Profit | 65.00, 66.06 |
| Stop Loss | 61.81 |
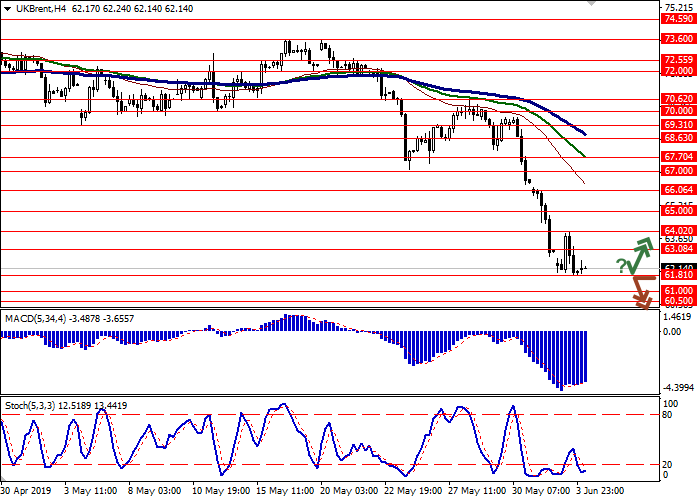
| Key Levels | 60.50, 61.00, 61.81, 63.08, 64.02, 65.00, 66.06 |
| Alternative scenario | |
|---|---|
| Recommendation | SELL STOP |
| Entry Point | 61.75 |
| Take Profit | 60.50, 60.00 |
| Stop Loss | 62.60 |
| Key Levels | 60.50, 61.00, 61.81, 63.08, 64.02, 65.00, 66.06 |
Current trend
Oil prices continue to show negative dynamics. The main downward factor for the instrument remains the decline in global demand for raw materials amid worsening trade conflicts. Donald Trump’s statements about the intention to introduce import duties on Mexican goods from June 10, which were likely to have a negative impact on Mexican oil imports, hit the quotes hard. The former threats of weakening demand against the background of the US-Chinese trade war still remain. Protracted negotiations between the parties have not yet led to consensus, and Washington has only aggravated the situation, imposing tough sanctions against the Chinese Huawei. In turn, quotes are supported by positive statements by Saudi Arabia that the OPEC+ deal will continue to be implemented by all members of the cartel.
Support and resistance
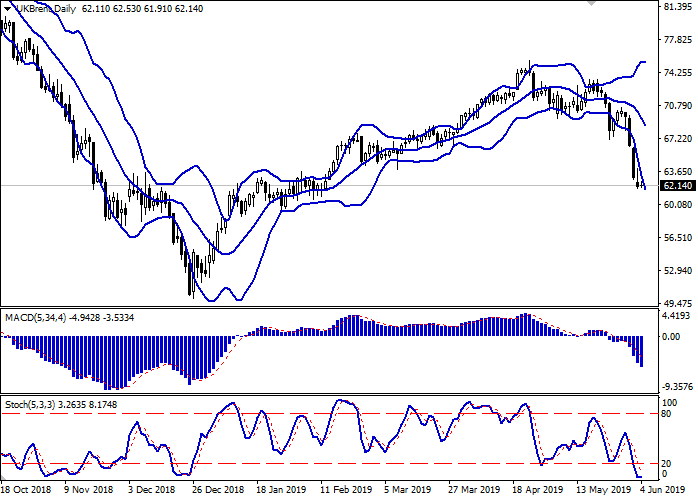
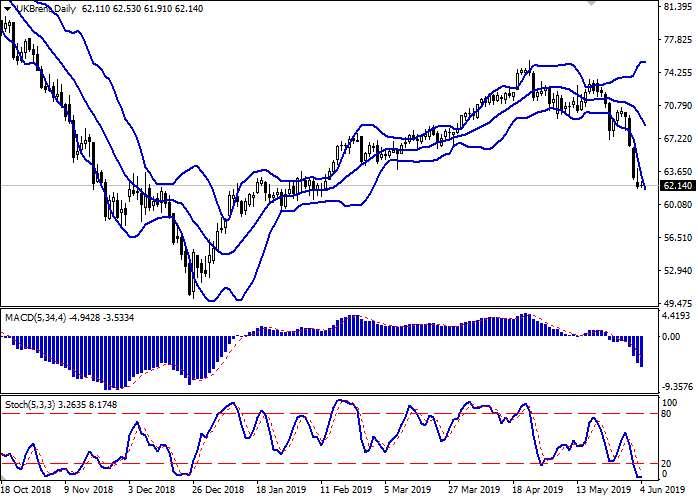
Bollinger Bands in D1 chart demonstrate active decrease. The price range is rapidly expanding, but it fails to catch the development of negative trend at the moment. MACD is going down preserving a stable sell signal (located below the signal line). Stochastic, having reached its lows, reversed to the horizontal plane, indicating risks of correctional growth in the short and/or ultra-short term.
One should wait for development of the situation. There is no need to rush with the opening of new short positions.
Resistance levels: 63.08, 64.02, 65.00, 66.06.
Support levels: 61.81, 61.00, 60.50.


Trading tips
To open long positions, one can rely on the rebound from 61.81 as from support with the subsequent breakout of 63.08. Take profit — 65.00 or 66.06. Stop loss — 61.81. Implementation time: 2-3 days.
A confident breakdown of 61.81 may become a signal to further sales with target at 60.50 or 60.00. Stop loss — 62.60. Implementation time: 1-2 days.
Oil prices continue to show negative dynamics. The main downward factor for the instrument remains the decline in global demand for raw materials amid worsening trade conflicts. Donald Trump’s statements about the intention to introduce import duties on Mexican goods from June 10, which were likely to have a negative impact on Mexican oil imports, hit the quotes hard. The former threats of weakening demand against the background of the US-Chinese trade war still remain. Protracted negotiations between the parties have not yet led to consensus, and Washington has only aggravated the situation, imposing tough sanctions against the Chinese Huawei. In turn, quotes are supported by positive statements by Saudi Arabia that the OPEC+ deal will continue to be implemented by all members of the cartel.
Support and resistance
Bollinger Bands in D1 chart demonstrate active decrease. The price range is rapidly expanding, but it fails to catch the development of negative trend at the moment. MACD is going down preserving a stable sell signal (located below the signal line). Stochastic, having reached its lows, reversed to the horizontal plane, indicating risks of correctional growth in the short and/or ultra-short term.
One should wait for development of the situation. There is no need to rush with the opening of new short positions.
Resistance levels: 63.08, 64.02, 65.00, 66.06.
Support levels: 61.81, 61.00, 60.50.


Trading tips
To open long positions, one can rely on the rebound from 61.81 as from support with the subsequent breakout of 63.08. Take profit — 65.00 or 66.06. Stop loss — 61.81. Implementation time: 2-3 days.
A confident breakdown of 61.81 may become a signal to further sales with target at 60.50 or 60.00. Stop loss — 62.60. Implementation time: 1-2 days.


No comments:
Write comments