USD/JPY: USD remains under pressure
04 June 2019, 10:15
| Scenario | |
|---|---|
| Timeframe | Intraday |
| Recommendation | BUY STOP |
| Entry Point | 108.55 |
| Take Profit | 109.76, 110.00 |
| Stop Loss | 107.84 |
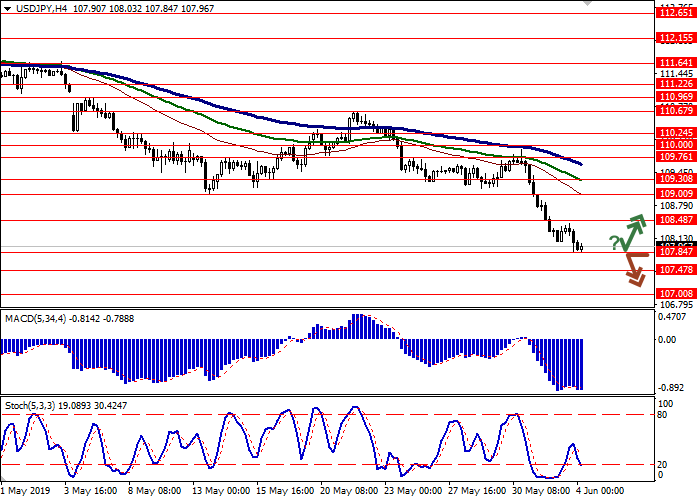
| Key Levels | 107.00, 107.47, 107.84, 108.48, 109.00, 109.30, 109.76 |
| Alternative scenario | |
|---|---|
| Recommendation | SELL STOP |
| Entry Point | 107.80 |
| Take Profit | 107.00 |
| Stop Loss | 108.25 |
| Key Levels | 107.00, 107.47, 107.84, 108.48, 109.00, 109.30, 109.76 |
Current trend
USD continues to weaken against JPY against the background of a further decline in investor interest in risk. The focus of the market is on US trade conflicts that threaten with a slowdown in global economic growth. Earlier, Donald Trump put forward a new ultimatum to Mexico. The US will increase import duties on all Mexican goods from June 10, unless the Mexican government takes measures to reduce the flow of migrants across the southern borders of the United States.
Monday's macroeconomic statistics from Japan provided little support to the yen. Nikkei Manufacturing PMI grew from 49.6 to 49.8 points which was better than expected (49.6 points). Capital Spending in Q1 2019 grew from 5.7% to 6.1% with the forecast of +11.6%.
Support and resistance
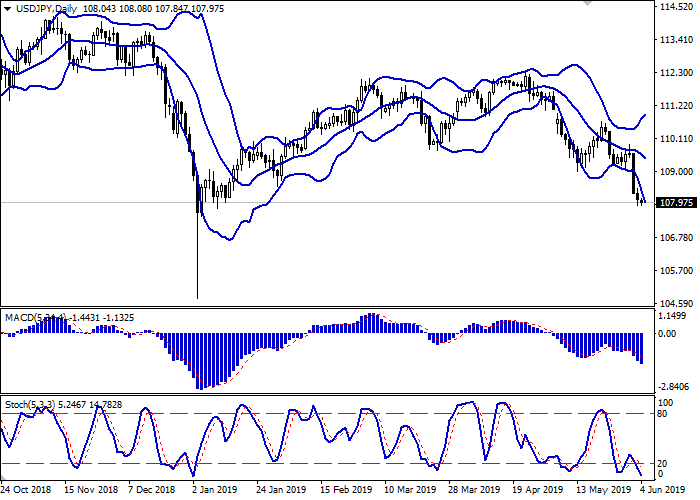
Bollinger Bands in D1 chart demonstrate a gradual decrease. The price range is expanding, but the instrument is currently located outside of its borders, which may indicate the risks of corrective growth. MACD is going down keeping a moderate sell signal (located below the signal line). Stochastic keeps a confident downward direction but is located near its minimum levels, which indicates the oversold USD in the ultra-short term.
One should wait for clarification of the situation. Some of existing short positions in the short term should be left open for some time.
Resistance levels: 108.48, 109.00, 109.30, 109.76.
Support levels: 107.84, 107.47, 107.00.


Trading tips
To open long positions, one can rely on the rebound from 107.84 as from support with the subsequent breakout of 108.48. Take profit — 109.76 or 110.00. Stop loss — 107.84. Implementation time: 2-3 days.
The breakdown of 107.84 may serve as a signal to further sales with the target at 107.00. Stop loss — 108.25. Implementation time: 1-2 days.
USD continues to weaken against JPY against the background of a further decline in investor interest in risk. The focus of the market is on US trade conflicts that threaten with a slowdown in global economic growth. Earlier, Donald Trump put forward a new ultimatum to Mexico. The US will increase import duties on all Mexican goods from June 10, unless the Mexican government takes measures to reduce the flow of migrants across the southern borders of the United States.
Monday's macroeconomic statistics from Japan provided little support to the yen. Nikkei Manufacturing PMI grew from 49.6 to 49.8 points which was better than expected (49.6 points). Capital Spending in Q1 2019 grew from 5.7% to 6.1% with the forecast of +11.6%.
Support and resistance
Bollinger Bands in D1 chart demonstrate a gradual decrease. The price range is expanding, but the instrument is currently located outside of its borders, which may indicate the risks of corrective growth. MACD is going down keeping a moderate sell signal (located below the signal line). Stochastic keeps a confident downward direction but is located near its minimum levels, which indicates the oversold USD in the ultra-short term.
One should wait for clarification of the situation. Some of existing short positions in the short term should be left open for some time.
Resistance levels: 108.48, 109.00, 109.30, 109.76.
Support levels: 107.84, 107.47, 107.00.


Trading tips
To open long positions, one can rely on the rebound from 107.84 as from support with the subsequent breakout of 108.48. Take profit — 109.76 or 110.00. Stop loss — 107.84. Implementation time: 2-3 days.
The breakdown of 107.84 may serve as a signal to further sales with the target at 107.00. Stop loss — 108.25. Implementation time: 1-2 days.


No comments:
Write comments