Brent Crude Oil: quotes started to decline
25 June 2019, 09:58
| Scenario | |
|---|---|
| Timeframe | Intraday |
| Recommendation | BUY STOP |
| Entry Point | 65.30 |
| Take Profit | 67.70, 68.64 |
| Stop Loss | 64.00 |
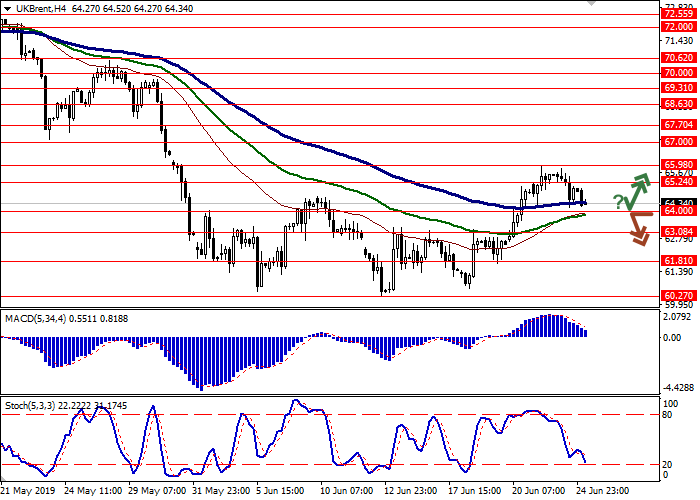
| Key Levels | 60.27, 61.81, 63.08, 64.00, 65.24, 65.98, 67.00, 67.70 |
| Alternative scenario | |
|---|---|
| Recommendation | SELL STOP |
| Entry Point | 63.95 |
| Take Profit | 60.27, 60.00 |
| Stop Loss | 65.24 |
| Key Levels | 60.27, 61.81, 63.08, 64.00, 65.24, 65.98, 67.00, 67.70 |
Current trend
Oil prices returned to decline at the beginning of the week, departing from local highs, updated on Friday. The reason for the decline in quotes was the existing factors of low demand for petroleum products against the background of a slowdown in the global economy and an increase in tensions in certain regions. In particular, the attention is focused on the conflict between the USA and Iran, aggravated after the US drone was shot down in the Persian Gulf. The conflict between the USA and China remains unresolved. However, investors have high hopes for meeting Donald Trump and Xi Jinping meeting at the G20 summit, which will be held at the end of the week in Japan.
On Tuesday, investors are focused on the speech of Fed Chairman Jerome Powell and on the publication of the API report on oil reserves for the week of June 21.
Support and resistance
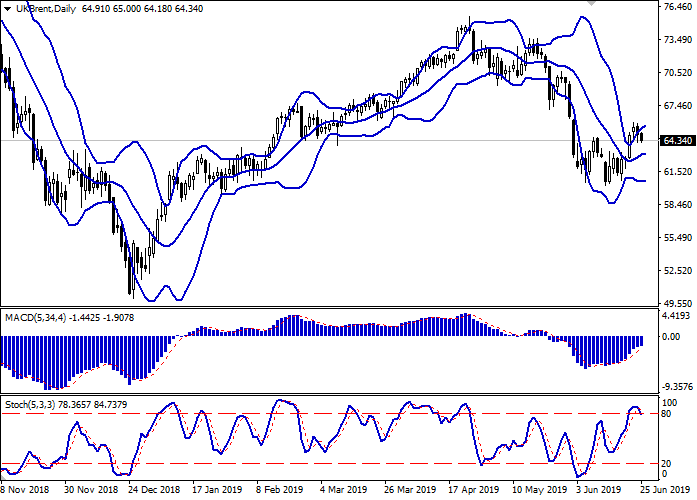
On the D1 chart, Bollinger Bands are reversing horizontally. The price range expands from above, freeing a path to new local highs for the "bulls". MACD indicator is growing preserving a weak buy signal (histogram is above the signal line). Stochastic, having consolidated above 80, reversed downwards, indicating the risk of corrective decline in the ultra-short term.
To open new short positions, one should wait for additional signals to appear.
Resistance levels: 65.24, 65.98, 67.00, 67.70.
Support levels: 64.00, 63.08, 61.81, 60.27.


Trading tips
Long positions may be opened if the price moves away from 64.00, as from support, followed by the breakout of 65.24. Take profit – 67.70 or 68.64. Stop loss – 64.00.
The breakdown of 64.00 may serve as a signal to start sales with the target at 60.27–60.00. Stop loss – 65.24.
Implementation period: 2-3 days.
Oil prices returned to decline at the beginning of the week, departing from local highs, updated on Friday. The reason for the decline in quotes was the existing factors of low demand for petroleum products against the background of a slowdown in the global economy and an increase in tensions in certain regions. In particular, the attention is focused on the conflict between the USA and Iran, aggravated after the US drone was shot down in the Persian Gulf. The conflict between the USA and China remains unresolved. However, investors have high hopes for meeting Donald Trump and Xi Jinping meeting at the G20 summit, which will be held at the end of the week in Japan.
On Tuesday, investors are focused on the speech of Fed Chairman Jerome Powell and on the publication of the API report on oil reserves for the week of June 21.
Support and resistance
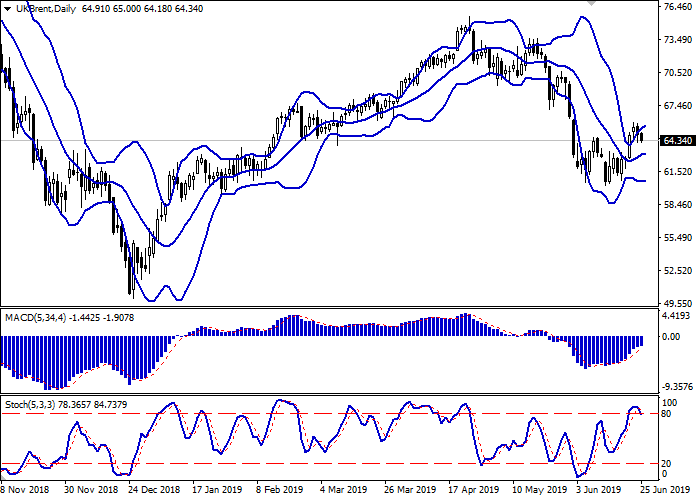
On the D1 chart, Bollinger Bands are reversing horizontally. The price range expands from above, freeing a path to new local highs for the "bulls". MACD indicator is growing preserving a weak buy signal (histogram is above the signal line). Stochastic, having consolidated above 80, reversed downwards, indicating the risk of corrective decline in the ultra-short term.
To open new short positions, one should wait for additional signals to appear.
Resistance levels: 65.24, 65.98, 67.00, 67.70.
Support levels: 64.00, 63.08, 61.81, 60.27.


Trading tips
Long positions may be opened if the price moves away from 64.00, as from support, followed by the breakout of 65.24. Take profit – 67.70 or 68.64. Stop loss – 64.00.
The breakdown of 64.00 may serve as a signal to start sales with the target at 60.27–60.00. Stop loss – 65.24.
Implementation period: 2-3 days.


No comments:
Write comments