AUD/USD: Australian dollar strengthens
25 June 2019, 09:59
| Scenario | |
|---|---|
| Timeframe | Intraday |
| Recommendation | BUY STOP |
| Entry Point | 0.6975 |
| Take Profit | 0.7000, 0.7021 |
| Stop Loss | 0.6950 |
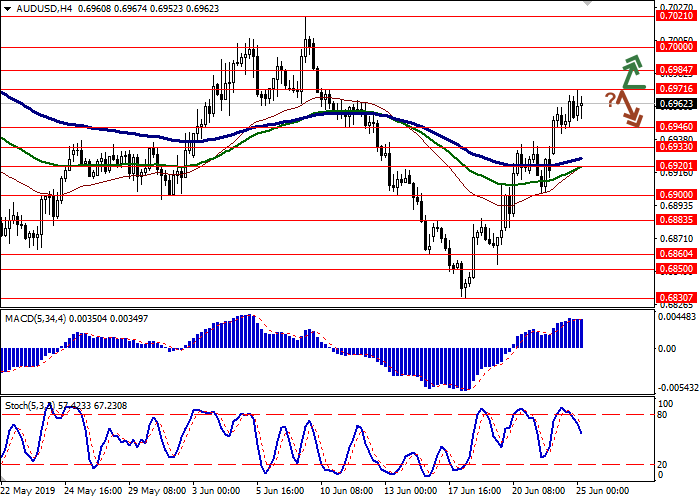
| Key Levels | 0.6900, 0.6920, 0.6933, 0.6946, 0.6971, 0.6984, 0.7000, 0.7021 |
| Alternative scenario | |
|---|---|
| Recommendation | SELL STOP |
| Entry Point | 0.6945, 0.6940 |
| Take Profit | 0.6900 |
| Stop Loss | 0.6971 |
| Key Levels | 0.6900, 0.6920, 0.6933, 0.6946, 0.6971, 0.6984, 0.7000, 0.7021 |
Current trend
Yesterday, the pair AUD/USD rose, growing to new highs of 10 June. There is a lack of new drivers, so USD is significantly losing AUD due to increased tensions, including the escalation of US-Iranian conflict and the upcoming meeting of the heads of the United States and China. Despite the optimistic mood of the market, analysts fear that if the June negotiations of Donald Trump and Xi Jinping come to a standstill, the next chance to normalize trade relations between the countries will not appear soon. Monday’s US macroeconomic statistics was ambiguous. May’s Chicago Fed National Activity Index rose from –0.48 to –0.05 points, which was significantly better than forecasts (–0.37 points). June’s Dallas Fed Manufacturing Business Index fell from –5.3 to –12.1 points, contrary to forecasts of growth to 4.8 points.
Support and resistance
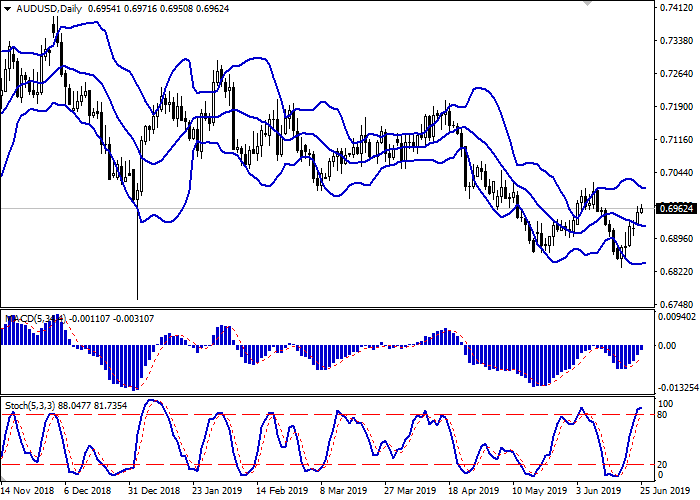
On the daily chart, Bollinger bands reverse horizontally. The price range is virtually unchanged but remains quite spacious for the current level of activity. The MACD grows, keeping a strong buy signal (the histogram is above the signal line), and is preparing to test the zero line for a breakout. Stochastic, approaching its highs, reverses horizontally, reflecting that the instrument can become overbought in the super short term.
It is better to keep current long positions in the short and/or super short term until the situation becomes clearer.
Resistance levels: 0.6971, 0.6984, 0.7000, 0.7021.
Support levels: 0.6946, 0.6933, 0.6920, 0.6900.


Trading tips
Long positions can be opened after the breakout of 0.6971 with the target at 0.7000 or 0.7021. Stop loss – 0.6950. Implementation period: 1–2 days.
Short positions can be opened after a rebound from 0.6971 and the breakdown of 0.6950–0.6946 with the target at 0.6900. Stop loss – 0.6971. Implementation period: 2–3 days.
Yesterday, the pair AUD/USD rose, growing to new highs of 10 June. There is a lack of new drivers, so USD is significantly losing AUD due to increased tensions, including the escalation of US-Iranian conflict and the upcoming meeting of the heads of the United States and China. Despite the optimistic mood of the market, analysts fear that if the June negotiations of Donald Trump and Xi Jinping come to a standstill, the next chance to normalize trade relations between the countries will not appear soon. Monday’s US macroeconomic statistics was ambiguous. May’s Chicago Fed National Activity Index rose from –0.48 to –0.05 points, which was significantly better than forecasts (–0.37 points). June’s Dallas Fed Manufacturing Business Index fell from –5.3 to –12.1 points, contrary to forecasts of growth to 4.8 points.
Support and resistance
On the daily chart, Bollinger bands reverse horizontally. The price range is virtually unchanged but remains quite spacious for the current level of activity. The MACD grows, keeping a strong buy signal (the histogram is above the signal line), and is preparing to test the zero line for a breakout. Stochastic, approaching its highs, reverses horizontally, reflecting that the instrument can become overbought in the super short term.
It is better to keep current long positions in the short and/or super short term until the situation becomes clearer.
Resistance levels: 0.6971, 0.6984, 0.7000, 0.7021.
Support levels: 0.6946, 0.6933, 0.6920, 0.6900.


Trading tips
Long positions can be opened after the breakout of 0.6971 with the target at 0.7000 or 0.7021. Stop loss – 0.6950. Implementation period: 1–2 days.
Short positions can be opened after a rebound from 0.6971 and the breakdown of 0.6950–0.6946 with the target at 0.6900. Stop loss – 0.6971. Implementation period: 2–3 days.


No comments:
Write comments