AUD/USD: AUD is strengthening
05 June 2019, 10:23
| Scenario | |
|---|---|
| Timeframe | Intraday |
| Recommendation | BUY STOP |
| Entry Point | 0.7005, 0.7020 |
| Take Profit | 0.7051, 0.7072, 0.7100 |
| Stop Loss | 0.6970 |
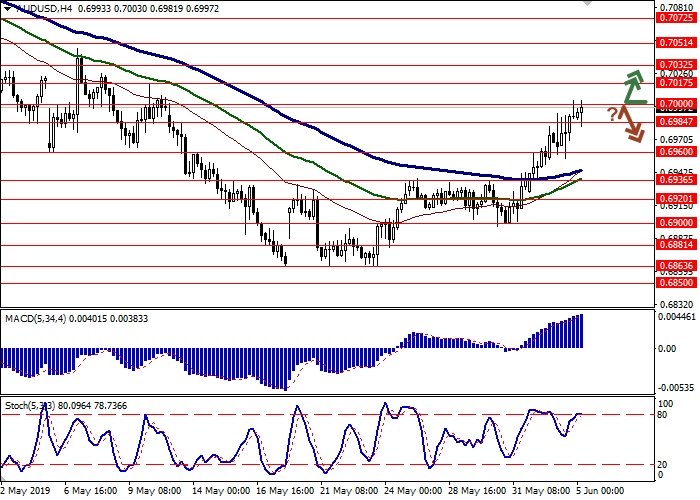
| Key Levels | 0.6920, 0.6936, 0.6960, 0.6984, 0.7000, 0.7017, 0.7032, 0.7051 |
| Alternative scenario | |
|---|---|
| Recommendation | SELL STOP |
| Entry Point | 0.6980, 0.6970 |
| Take Profit | 0.6920, 0.6900 |
| Stop Loss | 0.7000, 0.7015 |
| Key Levels | 0.6920, 0.6936, 0.6960, 0.6984, 0.7000, 0.7017, 0.7032, 0.7051 |
Current trend
AUD continues growing moderately against USD, updating the highs of 10 May. The growth of the instrument proceeds against the background of the publication of not the most confident macroeconomic statistics from Australia and yesterday's RBA decision to lower the interest rate to 1.25% for the first time in 3 years. This decision was quite predictable; therefore the pressure on AUD was moderate. In the follow-up statement, the RBA noted that it is trying to maintain employment and inflation levels that remain below target levels. Moreover, RBA officials did not rule out further steps to ease monetary policy.
Investors today are focused on the statistics on Australia's GDP for Q1 2019. The economy accelerated from +0.2% to +0.4% QoQ, which was slightly below the forecast of +0.5% QoQ. YoY, the growth of the index slowed down from +2.3% to +1.8%.
Support and resistance
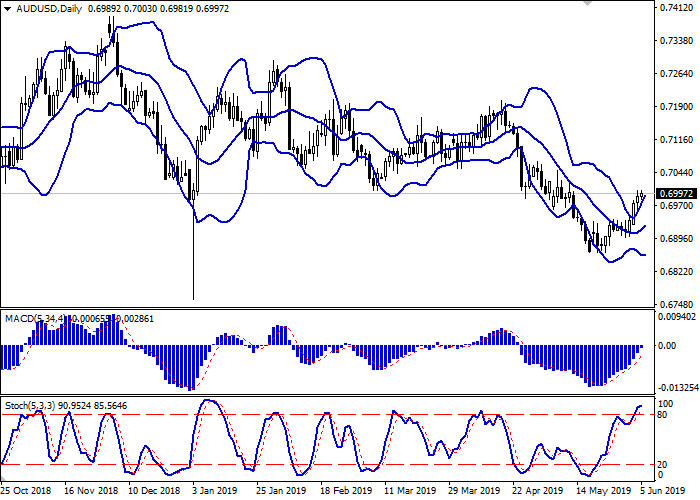
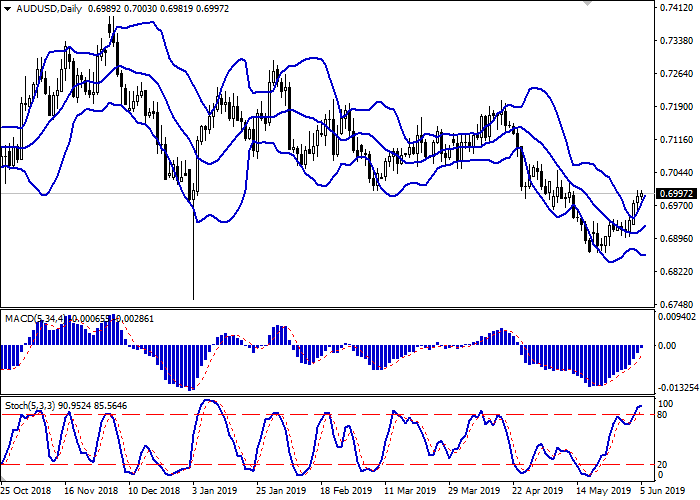
On the D1 chart, Bollinger Bands are gradually reversing to the ascending plane. The price range is expanding but fails to conform to the development of "bullish" trend at the moment. MACD is growing, keeping a buy signal (located above the signal line). Stochastic, approaching its maximum levels tends to reverse into a horizontal plane, which indicates the risk of a corrective decline in the ultra-short term.
One should wait for the clarification of trade signals.
Resistance levels: 0.7000, 0.7017, 0.7032, 0.7051.
Support levels: 0.6984, 0.6960, 0.6936, 0.6920.


Trading tips
To open long positions, one can rely on the breakout of 0.7000 or 0.7017. Take profit — 0.7051 or 0.7072–0.7100. Stop loss — 0.6990 or 0.6970.
The rebound from 0.7000 as from resistance with the subsequent breakdown of 0.6984–0.6975 can become a signal to new sales with target at 0.6920 or 0.6900. Stop loss — 0.7000–0.7015.
Implementation time: 2-3 days.
AUD continues growing moderately against USD, updating the highs of 10 May. The growth of the instrument proceeds against the background of the publication of not the most confident macroeconomic statistics from Australia and yesterday's RBA decision to lower the interest rate to 1.25% for the first time in 3 years. This decision was quite predictable; therefore the pressure on AUD was moderate. In the follow-up statement, the RBA noted that it is trying to maintain employment and inflation levels that remain below target levels. Moreover, RBA officials did not rule out further steps to ease monetary policy.
Investors today are focused on the statistics on Australia's GDP for Q1 2019. The economy accelerated from +0.2% to +0.4% QoQ, which was slightly below the forecast of +0.5% QoQ. YoY, the growth of the index slowed down from +2.3% to +1.8%.
Support and resistance
On the D1 chart, Bollinger Bands are gradually reversing to the ascending plane. The price range is expanding but fails to conform to the development of "bullish" trend at the moment. MACD is growing, keeping a buy signal (located above the signal line). Stochastic, approaching its maximum levels tends to reverse into a horizontal plane, which indicates the risk of a corrective decline in the ultra-short term.
One should wait for the clarification of trade signals.
Resistance levels: 0.7000, 0.7017, 0.7032, 0.7051.
Support levels: 0.6984, 0.6960, 0.6936, 0.6920.


Trading tips
To open long positions, one can rely on the breakout of 0.7000 or 0.7017. Take profit — 0.7051 or 0.7072–0.7100. Stop loss — 0.6990 or 0.6970.
The rebound from 0.7000 as from resistance with the subsequent breakdown of 0.6984–0.6975 can become a signal to new sales with target at 0.6920 or 0.6900. Stop loss — 0.7000–0.7015.
Implementation time: 2-3 days.


No comments:
Write comments