AUD/USD: AUD is correcting
20 June 2019, 09:56
| Scenario | |
|---|---|
| Timeframe | Intraday |
| Recommendation | BUY |
| Entry Point | 0.6903 |
| Take Profit | 0.6946, 0.6964 |
| Stop Loss | 0.6883, 0.6875 |
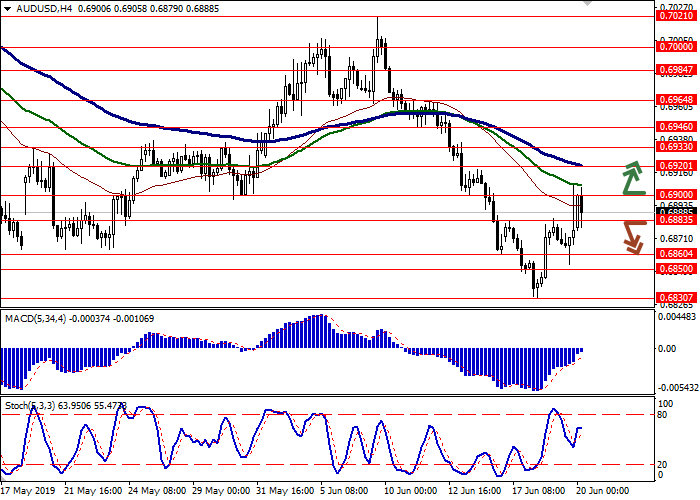
| Key Levels | 0.6830, 0.6850, 0.6860, 0.6883, 0.6900, 0.6920, 0.6933, 0.6946 |
| Alternative scenario | |
|---|---|
| Recommendation | SELL STOP |
| Entry Point | 0.6880, 0.6865 |
| Take Profit | 0.6830 |
| Stop Loss | 0.6885, 0.6900 |
| Key Levels | 0.6830, 0.6850, 0.6860, 0.6883, 0.6900, 0.6920, 0.6933, 0.6946 |
Current trend
The Australian dollar showed ambiguous dynamics against the US dollar on June 19. The instrument was moderately supported by corrective sentiment on the US currency that strengthened amid the "dovish" Fed rhetoric. In turn, macroeconomic statistics from Australia continued to put moderate pressure on the pair. The Westpac index of leading economic indicators in May showed a decline of 0.08% MoM after a decrease of 0.05% MoM in April.
Today, the instrument is trading upwards, and investors play on the publication of the RBA bulletin and the speech of the head of the regulator Philip Lowe. However, the speech of the RBA head had only a moderate impact on the AUD, since it was almost entirely devoted to the situation on the labor market and did not touch upon aspects of future monetary policy.
Support and resistance
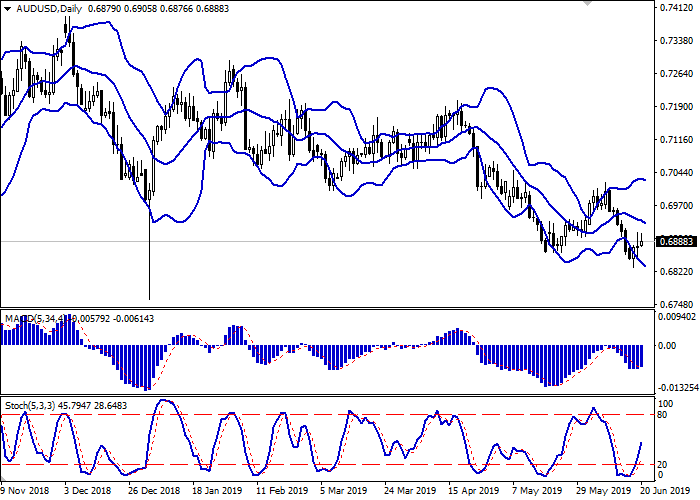
Bollinger Bands in D1 chart demonstrate a gradual decrease. The price range is gradually narrowing, but it remains rather spacious given the trade dynamics in the market. MACD indicator has reversed to growth preserving a buy signal (the histogram being located above the signal line). Stochastic is showing a more confident growth and is located in the middle of its area.
There's a possibility of an uptrend development in the short and/or ultra-short term.
Resistance levels: 0.6900, 0.6920, 0.6933, 0.6946.
Support levels: 0.6883, 0.6860, 0.6850, 0.6830.


Trading tips
To open long positions, one can rely on the breakout of 0.6900. Take profit – 0.6946 or 0.6964. Stop loss – 0.6883–0.6875.
A confident breakdown of 0.6883–0.6870 may serve as a signal to resume sales with the target at 0.6830. Stop loss — 0.6885 or 0.6900.
Implementation period: 2-3 days.
The Australian dollar showed ambiguous dynamics against the US dollar on June 19. The instrument was moderately supported by corrective sentiment on the US currency that strengthened amid the "dovish" Fed rhetoric. In turn, macroeconomic statistics from Australia continued to put moderate pressure on the pair. The Westpac index of leading economic indicators in May showed a decline of 0.08% MoM after a decrease of 0.05% MoM in April.
Today, the instrument is trading upwards, and investors play on the publication of the RBA bulletin and the speech of the head of the regulator Philip Lowe. However, the speech of the RBA head had only a moderate impact on the AUD, since it was almost entirely devoted to the situation on the labor market and did not touch upon aspects of future monetary policy.
Support and resistance
Bollinger Bands in D1 chart demonstrate a gradual decrease. The price range is gradually narrowing, but it remains rather spacious given the trade dynamics in the market. MACD indicator has reversed to growth preserving a buy signal (the histogram being located above the signal line). Stochastic is showing a more confident growth and is located in the middle of its area.
There's a possibility of an uptrend development in the short and/or ultra-short term.
Resistance levels: 0.6900, 0.6920, 0.6933, 0.6946.
Support levels: 0.6883, 0.6860, 0.6850, 0.6830.


Trading tips
To open long positions, one can rely on the breakout of 0.6900. Take profit – 0.6946 or 0.6964. Stop loss – 0.6883–0.6875.
A confident breakdown of 0.6883–0.6870 may serve as a signal to resume sales with the target at 0.6830. Stop loss — 0.6885 or 0.6900.
Implementation period: 2-3 days.


No comments:
Write comments