XAU/USD: gold prices are rising
20 June 2019, 09:52
| Scenario | |
|---|---|
| Timeframe | Intraday |
| Recommendation | BUY STOP |
| Entry Point | 1393.80, 1400.10 |
| Take Profit | 1415.00 |
| Stop Loss | 1385.00, 1380.00 |
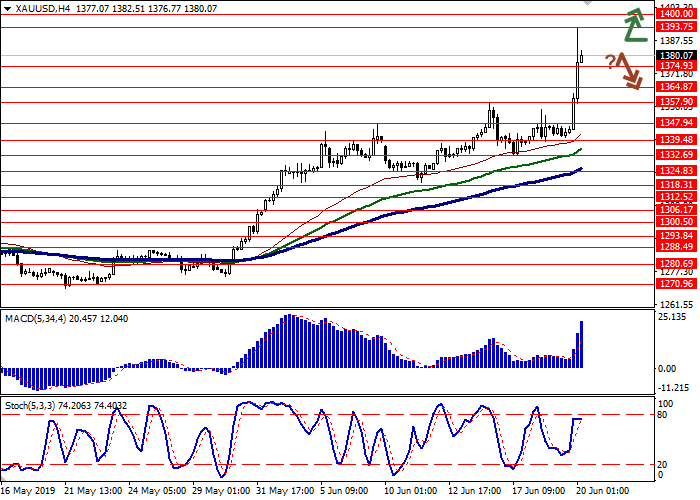
| Key Levels | 1347.94, 1357.90, 1364.87, 1374.93, 1393.75, 1400.00 |
| Alternative scenario | |
|---|---|
| Recommendation | SELL STOP |
| Entry Point | 1374.90 |
| Take Profit | 1347.94 |
| Stop Loss | 1385.00 |
| Key Levels | 1347.94, 1357.90, 1364.87, 1374.93, 1393.75, 1400.00 |
Current trend
Yesterday, gold prices rose steadily. Today, during the Asian session, the growth is actively continuing, and the quotes have renewed record highs since 2013. The instrument is supported by the “dovish” rhetoric of the US Federal Reserve, which allows traders to count on lowering interest rates at the July meeting of the regulator. Moreover, analysts believe that the regulator may lower the rate twice before the end of the current calendar year.
The price is under pressure of the prospect of concluding a trade agreement between the US and China during the G20 summit. Investors are very encouraged by Donald Trump's statements, so they prefer riskier assets.
Support and resistance
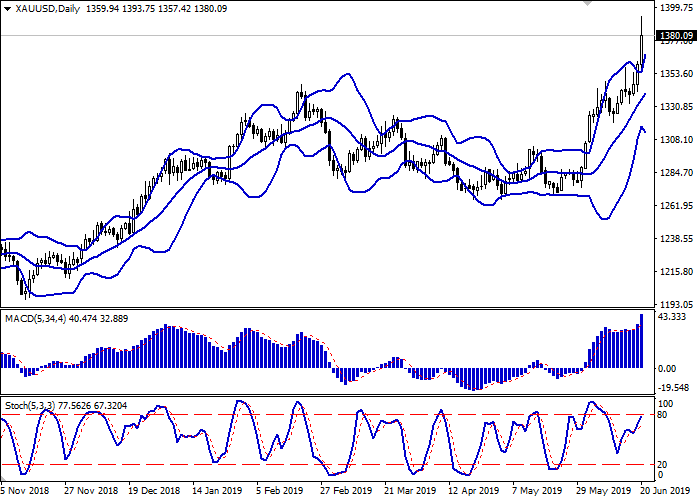
Bollinger bands are actively growing on the daily chart. The price range expands but not as fast as the "bullish" sentiments develop. The MACD indicator is growing, keeping a strong buy signal (the histogram is above the signal line). Stochastic is pointed upwards but is nearing its highs, which indicates that the instrument can become overbought in the super-short term.
It is better to keep current long positions in the short and/or super short term until the situation becomes clearer.
Resistance levels: 1393.75, 1400.00.
Support levels: 1374.93, 1364.87, 1357.90, 1347.94.


Trading tips
Long positions can be opened after the breakout of the level of 1393.75 or 1400.00 with the target at 1415.00. Stop loss is 1385.00 or 1380.00.
Short positions can be opened after a downward reversal near current levels and a breakdown of 1374.93 with the target at 1347.94. Stop loss is 1385.00.
Implementation period: 2–3 days.
Yesterday, gold prices rose steadily. Today, during the Asian session, the growth is actively continuing, and the quotes have renewed record highs since 2013. The instrument is supported by the “dovish” rhetoric of the US Federal Reserve, which allows traders to count on lowering interest rates at the July meeting of the regulator. Moreover, analysts believe that the regulator may lower the rate twice before the end of the current calendar year.
The price is under pressure of the prospect of concluding a trade agreement between the US and China during the G20 summit. Investors are very encouraged by Donald Trump's statements, so they prefer riskier assets.
Support and resistance
Bollinger bands are actively growing on the daily chart. The price range expands but not as fast as the "bullish" sentiments develop. The MACD indicator is growing, keeping a strong buy signal (the histogram is above the signal line). Stochastic is pointed upwards but is nearing its highs, which indicates that the instrument can become overbought in the super-short term.
It is better to keep current long positions in the short and/or super short term until the situation becomes clearer.
Resistance levels: 1393.75, 1400.00.
Support levels: 1374.93, 1364.87, 1357.90, 1347.94.


Trading tips
Long positions can be opened after the breakout of the level of 1393.75 or 1400.00 with the target at 1415.00. Stop loss is 1385.00 or 1380.00.
Short positions can be opened after a downward reversal near current levels and a breakdown of 1374.93 with the target at 1347.94. Stop loss is 1385.00.
Implementation period: 2–3 days.


No comments:
Write comments