
NZD/USD: NZD is strengthening
18 February 2019, 09:24
| Scenario | |
|---|---|
| Timeframe | Intraday |
| Recommendation | BUY STOP |
| Entry Point | 0.6910 |
| Take Profit | 0.6940, 0.6968 |
| Stop Loss | 0.6880 |
| Key Levels | 0.6789, 0.6814, 0.6847, 0.6871, 0.6904, 0.6923, 0.6940, 0.6968 |
| Alternative scenario | |
|---|---|
| Recommendation | SELL STOP |
| Entry Point | 0.6865 |
| Take Profit | 0.6830, 0.6814 |
| Stop Loss | 0.6890, 0.6900 |
| Key Levels | 0.6789, 0.6814, 0.6847, 0.6871, 0.6904, 0.6923, 0.6940, 0.6968 |
Current trend
The New Zealand dollar is steadily strengthening against the US one, updating local highs since February 6.
The "bullish" dynamics is facilitated by a noticeable improvement in geopolitical prospects. In particular, investors are optimistic about the US-Chinese trade negotiations. Last week, US trade delegation led by Treasury Secretary Steven Mnuchin was in Beijing. This week, negotiations will continue in Washington, as the PRC Chairman Xi Jinping announced on February 15.
In turn, the published macroeconomic statistics puts additional pressure on the instrument. On Friday, Manufacturing PMI was released in New Zealand. In January, the indicator dropped from 55.1 to 53.1 points, which turned out to be worse than the average analysts' forecasts. In December, the number of tourists arriving slowed from 7.1% YoY to 3.1% YoY.
Support and resistance
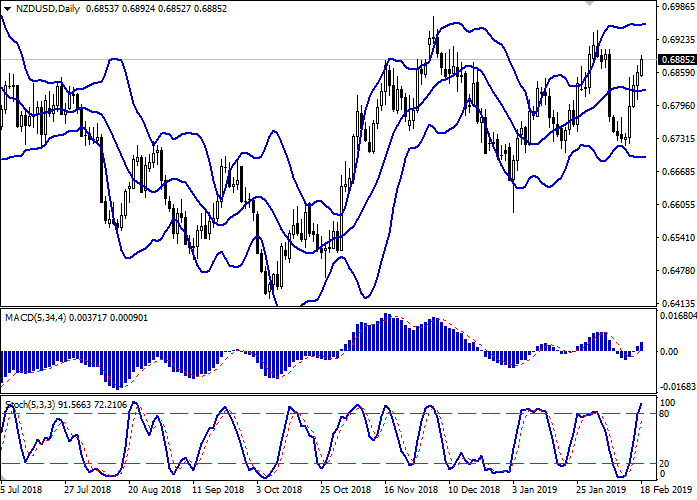
Bollinger Bands in D1 chart demonstrate flat dynamics. The price range was fixed within a fairly wide range and is almost unchanged at the moment. MACD indicator is growing preserving a stable buy signal (the histogram is above the signal line). Stochastic is growing almost vertically, but it is located near its maximum levels, which indicates the risks of overbought NZD in the short and/or ultra-short term. Indicators do not contradict the further development of the "bullish" trend in the short term.
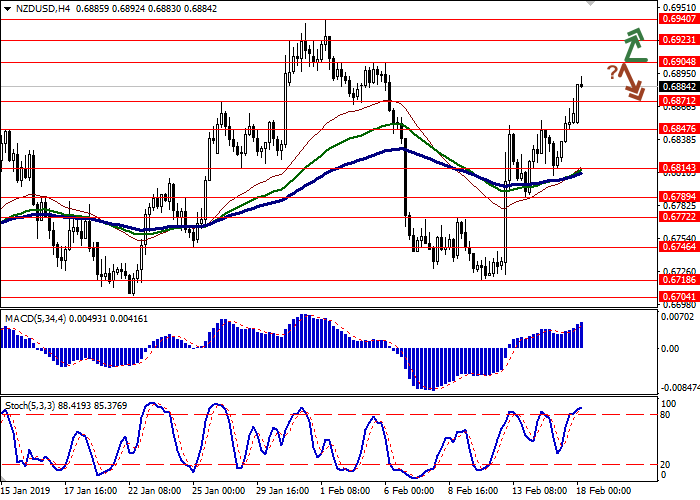
Resistance levels: 0.6904, 0.6923, 0.6940, 0.6968.
Support levels: 0.6871, 0.6847, 0.6814, 0.6789.
Trading tips
To open long positions, one can rely on the breakout of 0.6904. Take profit — 0.6940 or 0.6968. Stop loss – 0.6880. Implementation period: 2-3 days.
A rebound from the level of 0.6904, as from resistance, followed by a breakdown of 0.6880-0.6871, may become a signal for corrective sales with targets at 0.6830-0.6814. Stop loss — 0.6890 or 0.6900. Implementation period: 2-3 days.
The New Zealand dollar is steadily strengthening against the US one, updating local highs since February 6.
The "bullish" dynamics is facilitated by a noticeable improvement in geopolitical prospects. In particular, investors are optimistic about the US-Chinese trade negotiations. Last week, US trade delegation led by Treasury Secretary Steven Mnuchin was in Beijing. This week, negotiations will continue in Washington, as the PRC Chairman Xi Jinping announced on February 15.
In turn, the published macroeconomic statistics puts additional pressure on the instrument. On Friday, Manufacturing PMI was released in New Zealand. In January, the indicator dropped from 55.1 to 53.1 points, which turned out to be worse than the average analysts' forecasts. In December, the number of tourists arriving slowed from 7.1% YoY to 3.1% YoY.
Support and resistance
Bollinger Bands in D1 chart demonstrate flat dynamics. The price range was fixed within a fairly wide range and is almost unchanged at the moment. MACD indicator is growing preserving a stable buy signal (the histogram is above the signal line). Stochastic is growing almost vertically, but it is located near its maximum levels, which indicates the risks of overbought NZD in the short and/or ultra-short term. Indicators do not contradict the further development of the "bullish" trend in the short term.
Resistance levels: 0.6904, 0.6923, 0.6940, 0.6968.
Support levels: 0.6871, 0.6847, 0.6814, 0.6789.
Trading tips
To open long positions, one can rely on the breakout of 0.6904. Take profit — 0.6940 or 0.6968. Stop loss – 0.6880. Implementation period: 2-3 days.
A rebound from the level of 0.6904, as from resistance, followed by a breakdown of 0.6880-0.6871, may become a signal for corrective sales with targets at 0.6830-0.6814. Stop loss — 0.6890 or 0.6900. Implementation period: 2-3 days.


No comments:
Write comments