XAG/USD: ambiguous dynamics
17 January 2019, 09:05
| Scenario | |
|---|---|
| Timeframe | Intraday |
| Recommendation | BUY STOP |
| Entry Point | 15.68 |
| Take Profit | 15.84, 16.00 |
| Stop Loss | 15.55, 15.50 |
| Key Levels | 15.00, 15.09, 15.24, 15.37, 15.47, 15.66, 15.75, 15.84, 16.00 |
| Alternative scenario | |
|---|---|
| Recommendation | SELL STOP |
| Entry Point | 15.45 |
| Take Profit | 15.24, 15.15 |
| Stop Loss | 15.58 |
| Key Levels | 15.00, 15.09, 15.24, 15.37, 15.47, 15.66, 15.75, 15.84, 16.00 |
Current trend
After the renewal of local highs at the beginning of the month, silver price continues to trade in different directions, consolidating near the level of 15.50. The weak position of USD does not let the rate fall significantly. Recently, the instrument was supported by poor macroeconomic signals from China, which made investors fear of the slowdown in the Chinese economy.
In addition, the protracted American Shutdown has a positive effect on the price. Donald Trump met with the leaders of the Democratic Party and rejected proposals for a temporary resumption of the work of the government, after which no progress has been made on this issue. Trump may declare a state of emergency in the United States to receive funds for the construction of a wall on the Mexico border, bypassing Congress.
Support and resistance
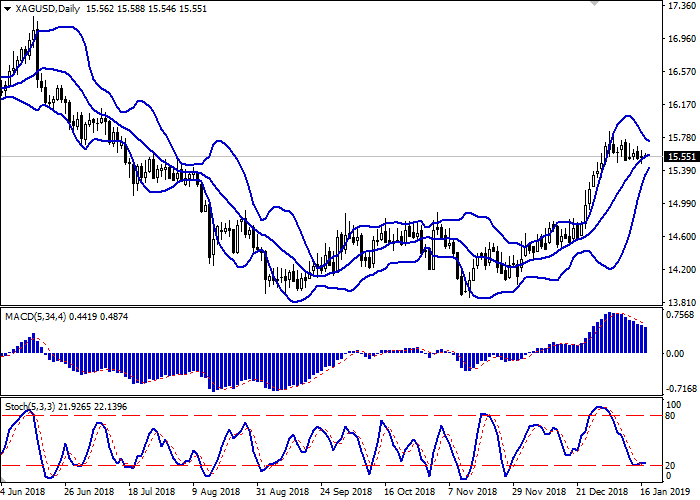
On the daily chart, Bollinger bands reverse horizontally. The price range narrows, reflecting the ambiguous nature of trading in the short term. The MACD indicator is falling, keeping a strong sell signal (the histogram is below the signal line). Stochastic, reaching its lows, reversed horizontally, indicating that the instrument can become oversold in the super short term.
It is better to wait for the appearance of new signals from technical indicators and keep part of current short positions for some time.
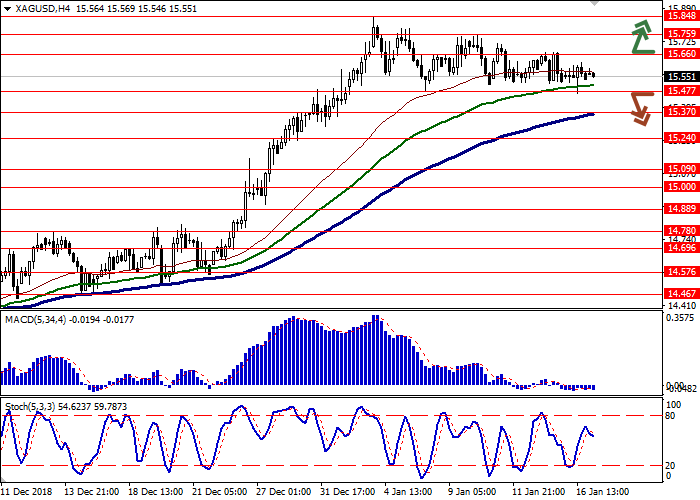
Resistance levels: 15.66, 15.75, 15.84, 16.00.
Support levels: 15.47, 15.37, 15.24, 15.09, 15.00.


Trading tips
Long positions can be opened after the breakout of the level of 15.66 with the target at 15.84 or 16.00. Stop loss is 15.55–15.50.
Short positions can be opened after the breakdown of the level of 15.47 with the targets at 15.24–15.15. Stop loss is 15.58.
Implementation period: 2–3 days.
After the renewal of local highs at the beginning of the month, silver price continues to trade in different directions, consolidating near the level of 15.50. The weak position of USD does not let the rate fall significantly. Recently, the instrument was supported by poor macroeconomic signals from China, which made investors fear of the slowdown in the Chinese economy.
In addition, the protracted American Shutdown has a positive effect on the price. Donald Trump met with the leaders of the Democratic Party and rejected proposals for a temporary resumption of the work of the government, after which no progress has been made on this issue. Trump may declare a state of emergency in the United States to receive funds for the construction of a wall on the Mexico border, bypassing Congress.
Support and resistance
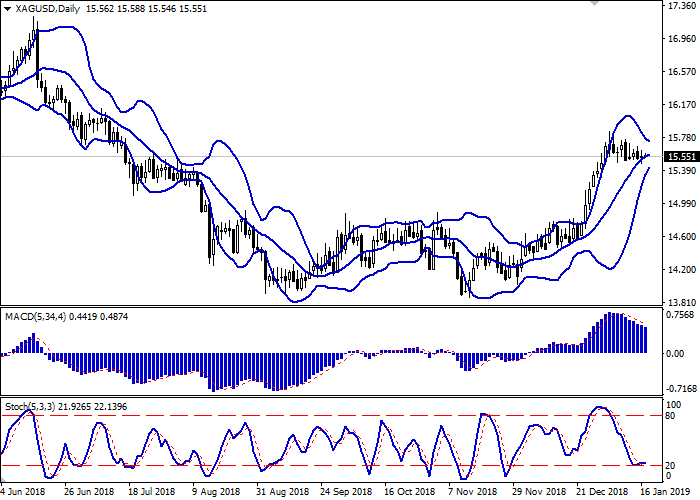
On the daily chart, Bollinger bands reverse horizontally. The price range narrows, reflecting the ambiguous nature of trading in the short term. The MACD indicator is falling, keeping a strong sell signal (the histogram is below the signal line). Stochastic, reaching its lows, reversed horizontally, indicating that the instrument can become oversold in the super short term.
It is better to wait for the appearance of new signals from technical indicators and keep part of current short positions for some time.
Resistance levels: 15.66, 15.75, 15.84, 16.00.
Support levels: 15.47, 15.37, 15.24, 15.09, 15.00.


Trading tips
Long positions can be opened after the breakout of the level of 15.66 with the target at 15.84 or 16.00. Stop loss is 15.55–15.50.
Short positions can be opened after the breakdown of the level of 15.47 with the targets at 15.24–15.15. Stop loss is 15.58.
Implementation period: 2–3 days.


No comments:
Write comments