NZD/USD: New Zealand dollar declines
17 January 2019, 08:54
| Scenario | |
|---|---|
| Timeframe | Intraday |
| Recommendation | BUY STOP |
| Entry Point | 0.6775, 0.6795 |
| Take Profit | 0.6842, 0.6860 |
| Stop Loss | 0.6750, 0.6740 |
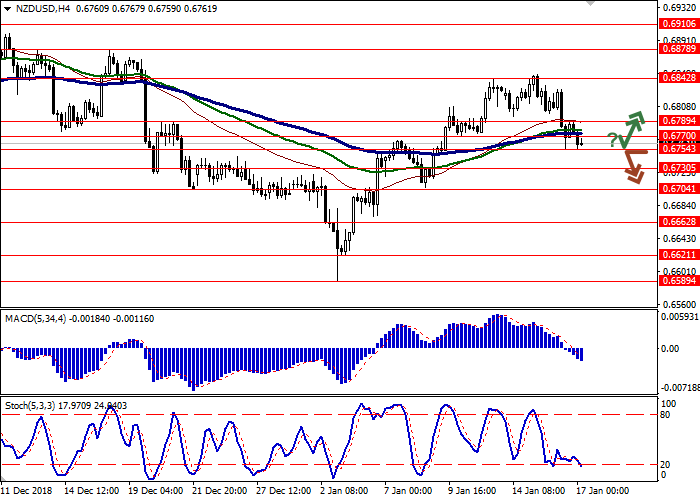
| Key Levels | 0.6662, 0.6704, 0.6730, 0.6754, 0.6770, 0.6789, 0.6842, 0.6878 |
| Alternative scenario | |
|---|---|
| Recommendation | SELL |
| Entry Point | 0.6750 |
| Take Profit | 0.6704, 0.6680, 0.6662 |
| Stop Loss | 0.6789, 0.6800 |
| Key Levels | 0.6662, 0.6704, 0.6730, 0.6754, 0.6770, 0.6789, 0.6842, 0.6878 |
Current trend
NZD fell against USD on Wednesday, departing from local highs, updated the day before.
The decrease proceeded against the background of the publication of not the most optimistic comments of the Fed representatives. In particular, Esther George, the head of Kansas City Fed, said that the regulator would have to pause in raising interest rates in order to assess how the economy responds to the complex of previous steps. Otherwise, there would be a risk of excessively tightening of the monetary policy, which will lead to an economic recession and pressure on inflation.
The Fed Beige Book has provided moderate support for USD: 8 out of 12 districts in the country showed moderate economic growth, which also correlated with a gradual increase in wages.
Support and resistance
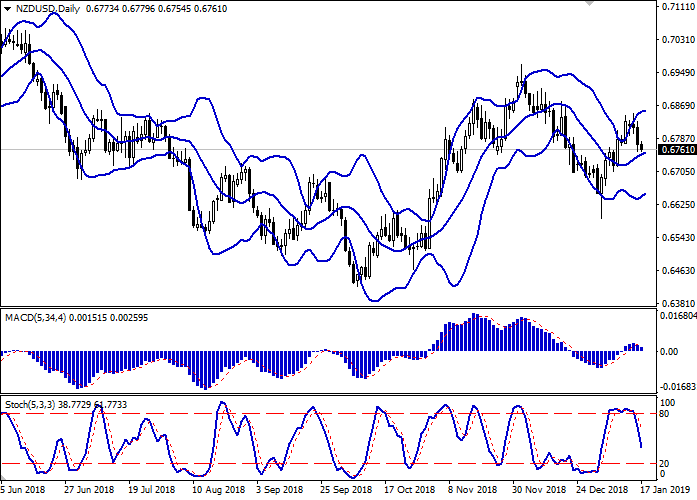
In the D1 chart Bollinger Bands demonstrate insignificant growth, keeping a tendency to reversal into a horizontal plane. The price range is narrowing, reflecting the appearance of ambiguous dynamics of trading. MACD is going down having formed a new sell signal (located below the signal line). Stochastic is falling more actively and is currently rapidly approaching the “20” level, which can be called the formal limit of oversold NZD.
The downward correction can develop further in the short and/or ultra-short term.
Resistance levels: 0.6770, 0.6789, 0.6842, 0.6878.
Support levels: 0.6754, 0.6730, 0.6704, 0.6662.


Trading tips
To open long positions, one can rely on the rebound from the support level of 0.6754 with the subsequent breakout of 0.6770 or 0.6789. Take profit — 0.6842 or 0.6860. Stop loss — 0.6750 or 0.6740.
A breakdown of 0.6754 may be a signal to further sales with targets at 0.6704 or 0.6680, 0.6662. Stop loss — 0.6789 or 0.6800.
Implementation period: 2-3 days.
NZD fell against USD on Wednesday, departing from local highs, updated the day before.
The decrease proceeded against the background of the publication of not the most optimistic comments of the Fed representatives. In particular, Esther George, the head of Kansas City Fed, said that the regulator would have to pause in raising interest rates in order to assess how the economy responds to the complex of previous steps. Otherwise, there would be a risk of excessively tightening of the monetary policy, which will lead to an economic recession and pressure on inflation.
The Fed Beige Book has provided moderate support for USD: 8 out of 12 districts in the country showed moderate economic growth, which also correlated with a gradual increase in wages.
Support and resistance
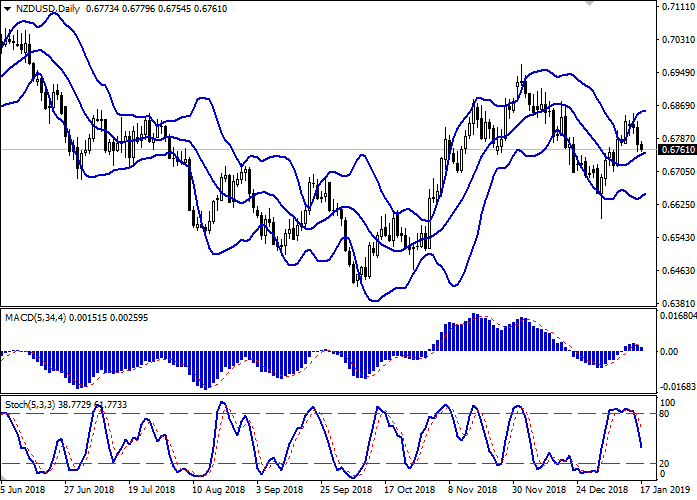
In the D1 chart Bollinger Bands demonstrate insignificant growth, keeping a tendency to reversal into a horizontal plane. The price range is narrowing, reflecting the appearance of ambiguous dynamics of trading. MACD is going down having formed a new sell signal (located below the signal line). Stochastic is falling more actively and is currently rapidly approaching the “20” level, which can be called the formal limit of oversold NZD.
The downward correction can develop further in the short and/or ultra-short term.
Resistance levels: 0.6770, 0.6789, 0.6842, 0.6878.
Support levels: 0.6754, 0.6730, 0.6704, 0.6662.


Trading tips
To open long positions, one can rely on the rebound from the support level of 0.6754 with the subsequent breakout of 0.6770 or 0.6789. Take profit — 0.6842 or 0.6860. Stop loss — 0.6750 or 0.6740.
A breakdown of 0.6754 may be a signal to further sales with targets at 0.6704 or 0.6680, 0.6662. Stop loss — 0.6789 or 0.6800.
Implementation period: 2-3 days.


No comments:
Write comments