
WTI Crude Oil: prices decrease
24 January 2019, 09:06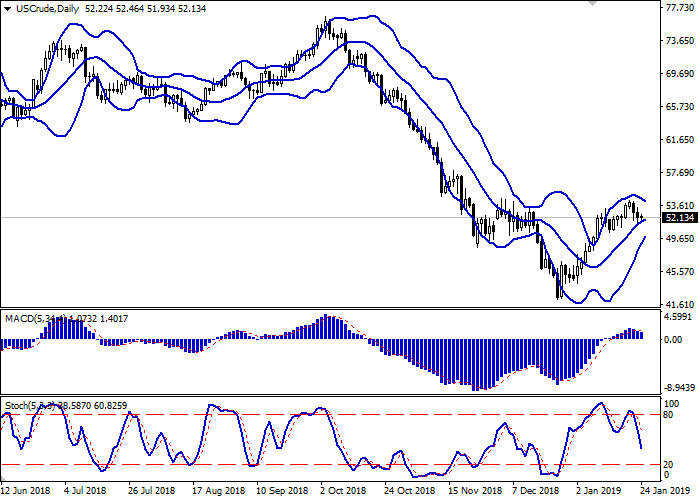
| Scenario | |
|---|---|
| Timeframe | Weekly |
| Recommendation | BUY STOP |
| Entry Point | 52.40, 52.50 |
| Take Profit | 54.50, 54.80 |
| Stop Loss | 51.50, 51.30 |
| Key Levels | 48.05, 49.00, 50.00, 50.92, 51.59, 53.19, 54.21, 55.64 |
| Alternative scenario | |
|---|---|
| Recommendation | SELL STOP |
| Entry Point | 51.50 |
| Take Profit | 50.00, 49.00 |
| Stop Loss | 52.50 |
| Key Levels | 48.05, 49.00, 50.00, 50.92, 51.59, 53.19, 54.21, 55.64 |
Current trend
Yesterday, oil prices declined, continuing the development of the “bearish” impulse formed the day before but during the day the dynamics of the instrument was mixed.
Strengthening was due to the intention of the Chinese government to stimulate its economy, which may lead to an increase in energy demand. EIA forecast supports the instrument, claiming that oil will continue to rise in the coming years. This year, the average price of a barrel will be $61, and in 2020 – $65. A negative point for the market is the cancellation of the meeting in Davos of Russian energy minister Alexander Novak and Saudi Arabian energy minister Khalid Al-Falih.
API Weekly Crude Oil Stock release affected the instrument negatively. For the week of January 19, stocks in the country rose sharply by 6.55 million barrels after a decline of 0.56 million barrels over the previous period.
Support and resistance
On the daily chart, Bollinger bands reverse horizontally. The price range narrows, reflecting the mixed nature of recent trading. MACD decreases, keeping a poor sell signal (the histogram is below the signal line). Stochastic falls, rapidly approaching its lows.
The readings do not contradict the further development of the “bearish” trend in the short and/or super short term.
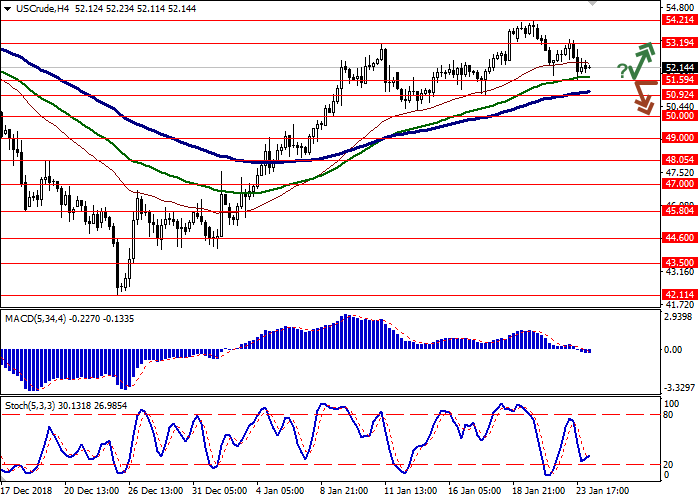
Resistance levels: 53.19, 54.21, 55.64.
Support levels: 51.59, 50.92, 50.00, 49.00, 48.05.

Trading tips
Long positions can be opened after the rebound from 51.59 and the breakout of 52.30–52.40 with the targets at 52.21 or 54.50–54.80. Stop loss is 51.50–51.30.
Short positions can be opened after the breakdown of 51.59 with the target at 50.00 or 49.00. Stop loss is 52.50.
Implementation period: 2–3 days.
Yesterday, oil prices declined, continuing the development of the “bearish” impulse formed the day before but during the day the dynamics of the instrument was mixed.
Strengthening was due to the intention of the Chinese government to stimulate its economy, which may lead to an increase in energy demand. EIA forecast supports the instrument, claiming that oil will continue to rise in the coming years. This year, the average price of a barrel will be $61, and in 2020 – $65. A negative point for the market is the cancellation of the meeting in Davos of Russian energy minister Alexander Novak and Saudi Arabian energy minister Khalid Al-Falih.
API Weekly Crude Oil Stock release affected the instrument negatively. For the week of January 19, stocks in the country rose sharply by 6.55 million barrels after a decline of 0.56 million barrels over the previous period.
Support and resistance
On the daily chart, Bollinger bands reverse horizontally. The price range narrows, reflecting the mixed nature of recent trading. MACD decreases, keeping a poor sell signal (the histogram is below the signal line). Stochastic falls, rapidly approaching its lows.
The readings do not contradict the further development of the “bearish” trend in the short and/or super short term.
Resistance levels: 53.19, 54.21, 55.64.
Support levels: 51.59, 50.92, 50.00, 49.00, 48.05.
Trading tips
Long positions can be opened after the rebound from 51.59 and the breakout of 52.30–52.40 with the targets at 52.21 or 54.50–54.80. Stop loss is 51.50–51.30.
Short positions can be opened after the breakdown of 51.59 with the target at 50.00 or 49.00. Stop loss is 52.50.
Implementation period: 2–3 days.


No comments:
Write comments