
XAU/USD: gold prices are consolidating
24 January 2019, 08:46
| Scenario | |
|---|---|
| Timeframe | Intraday |
| Recommendation | BUY STOP |
| Entry Point | 1286.31 |
| Take Profit | 1295.00, 1298.32 |
| Stop Loss | 1280.00 |
| Key Levels | 1257.82, 1260.75, 1266.26, 1270.11, 1276.58, 1283.26, 1286.31, 1288.52, 1292.69, 1298.32 |
| Alternative scenario | |
|---|---|
| Recommendation | SELL STOP |
| Entry Point | 1276.50 |
| Take Profit | 1270.11, 1266.26 |
| Stop Loss | 1280.00 |
| Key Levels | 1257.82, 1260.75, 1266.26, 1270.11, 1276.58, 1283.26, 1286.31, 1288.52, 1292.69, 1298.32 |
Current trend
Gold prices showed a negative trend on Wednesday, partially offsetting growth the day before. The instrument decline was triggered by the newly rising US stock indices, which led to a drop in demand for safe-haven assets in the market.
In turn, a more confident decline in gold prices is hampered by the weak positions of the US currency. The main pressure factor remains the tense situation around the US-China trade negotiations, as well as the US government shutdown, which adversely affects the economy and could lead to a slowdown in GDP growth. Macroeconomic statistics are not encouraging either. Tuesday's data on existing home sales in the US were poor. In December, sales decreased by 6.4% from 5.33M to 4.99M, which put pressure on USD.
Support and resistance
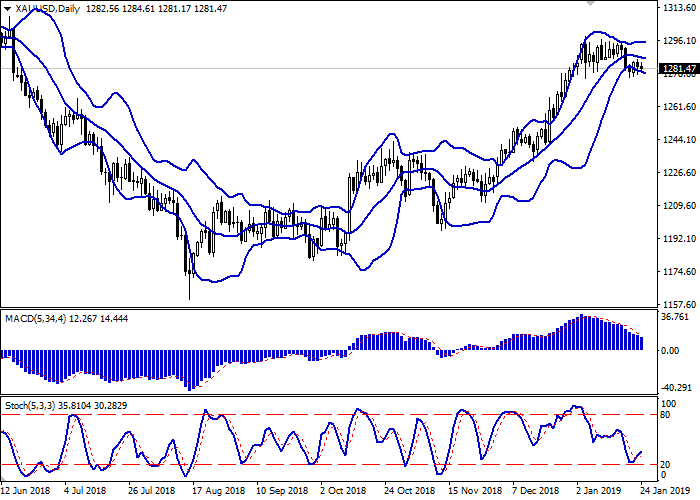
Bollinger Bands in D1 chart demonstrate flat dynamics. The price range is expanding from below, but it still remains narrow against the background of multidirectional trading dynamics of recent days. MACD is declining keeping a stable sell signal (located below the signal line). Stochastic, pushing away from the “20” level, reversed into the ascending plane, which so far correlates poorly with the real trend in the market. The indicator points at the risks associated with oversold gold in the ultra-short term.
One should wait for the clarification and formation of new trade signals.
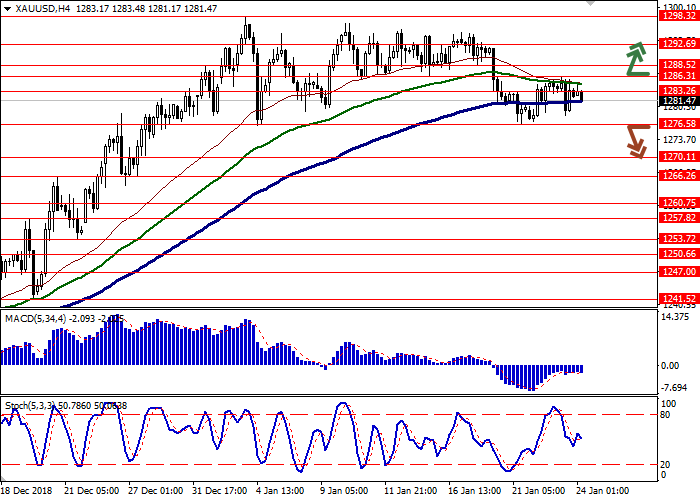
Resistance levels: 1283.26, 1286.31, 1288.52, 1292.69, 1298.32.
Support levels: 1276.58, 1270.11, 1266.26, 1260.75, 1257.82.
Trading tips
To open long positions, one can rely on the breakout of 1286.31. Take profit — 1295.00 or 1298.32. Stop loss — 1280.00.
The return of "bearish" trend with the breakdown of 1276.58 may become a signal for new sales with the target at 1270.11 or 1266.26. Stop loss — 1280.00.
Implementation period: 2-3 days.
Gold prices showed a negative trend on Wednesday, partially offsetting growth the day before. The instrument decline was triggered by the newly rising US stock indices, which led to a drop in demand for safe-haven assets in the market.
In turn, a more confident decline in gold prices is hampered by the weak positions of the US currency. The main pressure factor remains the tense situation around the US-China trade negotiations, as well as the US government shutdown, which adversely affects the economy and could lead to a slowdown in GDP growth. Macroeconomic statistics are not encouraging either. Tuesday's data on existing home sales in the US were poor. In December, sales decreased by 6.4% from 5.33M to 4.99M, which put pressure on USD.
Support and resistance
Bollinger Bands in D1 chart demonstrate flat dynamics. The price range is expanding from below, but it still remains narrow against the background of multidirectional trading dynamics of recent days. MACD is declining keeping a stable sell signal (located below the signal line). Stochastic, pushing away from the “20” level, reversed into the ascending plane, which so far correlates poorly with the real trend in the market. The indicator points at the risks associated with oversold gold in the ultra-short term.
One should wait for the clarification and formation of new trade signals.
Resistance levels: 1283.26, 1286.31, 1288.52, 1292.69, 1298.32.
Support levels: 1276.58, 1270.11, 1266.26, 1260.75, 1257.82.
Trading tips
To open long positions, one can rely on the breakout of 1286.31. Take profit — 1295.00 or 1298.32. Stop loss — 1280.00.
The return of "bearish" trend with the breakdown of 1276.58 may become a signal for new sales with the target at 1270.11 or 1266.26. Stop loss — 1280.00.
Implementation period: 2-3 days.


No comments:
Write comments