WTI Crude Oil: price is consolidating
14 January 2019, 08:43
| Scenario | |
|---|---|
| Timeframe | Intraday |
| Recommendation | BUY LIMIT |
| Entry Point | 50.00 |
| Take Profit | 52.00, 53.19 |
| Stop Loss | 49.00 |
| Key Levels | 45.80, 47.00, 48.05, 49.00, 50.00, 52.00, 53.19, 54.43, 55.64 |
| Alternative scenario | |
|---|---|
| Recommendation | SELL STOP |
| Entry Point | 49.95 |
| Take Profit | 48.05, 47.00 |
| Stop Loss | 51.00 |
| Key Levels | 45.80, 47.00, 48.05, 49.00, 50.00, 52.00, 53.19, 54.43, 55.64 |
Current trend
After an active growth at the beginning of the year, oil prices are consolidating near the level of $50 per barrel.
"Black gold" is supported by investors' hopes for a positive outcome of China-US trade negotiations and the end of the trade conflict in the near future. In addition, quotes are rising against the background of the Norwegian Petroleum Directorate, which reported a likely reduction in production by 4.8% to 1.42 million barrels per day in 2019, which is the minimum figure for the last 30 years.
Last Friday, Baker Hughes US Oil Rig Count report affected the instrument positively. During the week, the number of rigs decreased by 4 to 873 units. Over the past period, the figure also declined from 885 to 877.
Support and resistance
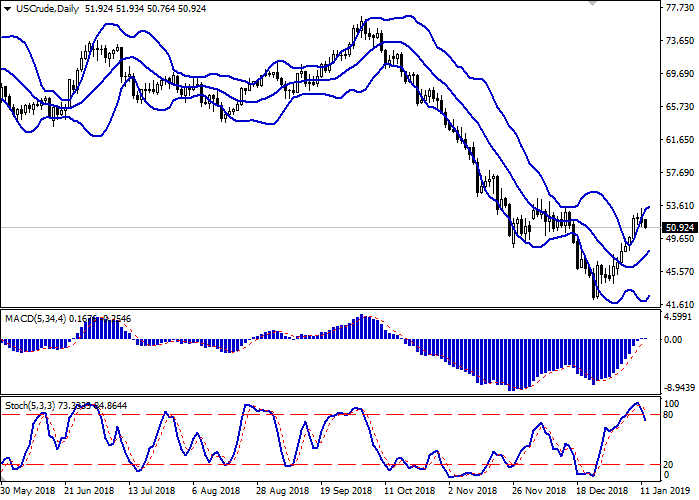
On the daily chart, Bollinger bands are growing steadily. The price range narrows, reflecting the emergence of ambiguous trading dynamics in the short term. The MACD indicator is growing, keeping a buy signal (the histogram is above the signal line), and is testing the zero line but is not likely to consolidate above it. Stochastic declines, reacting to the active “bearish” dynamics of the beginning of the week.
The current readings of the indicators do not contradict the further development of the corrective decline in the short and/or super short term.
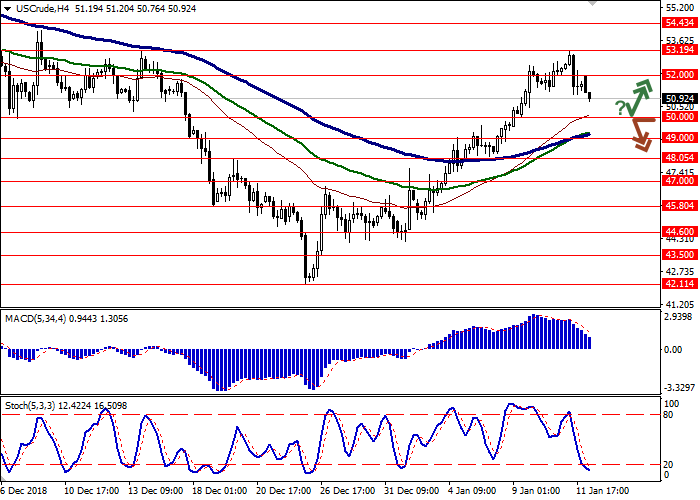
Resistance levels: 52.00, 53.19, 54.43, 55.64.
Support levels: 50.00, 49.00, 48.05, 47.00, 45.80.


Trading tips
Long positions can be opened after the rebound from the level of 50.00 with the target at 52.00 or 53.19. Stop loss is 49.00.
Short positions can be opened after the breakdown of the level of 50.00 with the target at 48.05 or 47.00. Stop loss is 51.00.
Implementation period: 2–3 days.
After an active growth at the beginning of the year, oil prices are consolidating near the level of $50 per barrel.
"Black gold" is supported by investors' hopes for a positive outcome of China-US trade negotiations and the end of the trade conflict in the near future. In addition, quotes are rising against the background of the Norwegian Petroleum Directorate, which reported a likely reduction in production by 4.8% to 1.42 million barrels per day in 2019, which is the minimum figure for the last 30 years.
Last Friday, Baker Hughes US Oil Rig Count report affected the instrument positively. During the week, the number of rigs decreased by 4 to 873 units. Over the past period, the figure also declined from 885 to 877.
Support and resistance
On the daily chart, Bollinger bands are growing steadily. The price range narrows, reflecting the emergence of ambiguous trading dynamics in the short term. The MACD indicator is growing, keeping a buy signal (the histogram is above the signal line), and is testing the zero line but is not likely to consolidate above it. Stochastic declines, reacting to the active “bearish” dynamics of the beginning of the week.
The current readings of the indicators do not contradict the further development of the corrective decline in the short and/or super short term.
Resistance levels: 52.00, 53.19, 54.43, 55.64.
Support levels: 50.00, 49.00, 48.05, 47.00, 45.80.


Trading tips
Long positions can be opened after the rebound from the level of 50.00 with the target at 52.00 or 53.19. Stop loss is 49.00.
Short positions can be opened after the breakdown of the level of 50.00 with the target at 48.05 or 47.00. Stop loss is 51.00.
Implementation period: 2–3 days.


No comments:
Write comments