USD/JPY: general review
16 January 2019, 14:14
| Scenario | |
|---|---|
| Timeframe | Weekly |
| Recommendation | BUY STOP |
| Entry Point | 108.90 |
| Take Profit | 109.37, 110.93 |
| Stop Loss | 108.30 |
| Key Levels | 106.25, 107.00, 107.80, 108.70, 109.37, 110.93 |
| Alternative scenario | |
|---|---|
| Recommendation | SELL STOP |
| Entry Point | 107.75 |
| Take Profit | 107.00, 106.25 |
| Stop Loss | 108.20 |
| Key Levels | 106.25, 107.00, 107.80, 108.70, 109.37, 110.93 |
Current trend
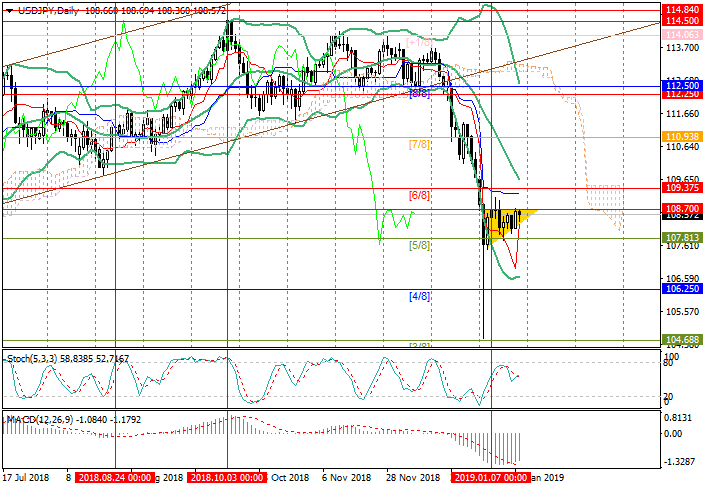
For the second week, the pair is consolidating within the range of 107.80-108.70.
Today, the yen is pressured by weak data on manufacturing orders, which are the main indicator of capital expenditures of Japanese companies. In November, the index was 0.0% instead of the expected growth of 3.1%. The volume of orders of enterprises in the industrial sector decreased by 6.4%, orders of public sector organizations - by 26.8%, and only orders from service companies grew by 2.5%. World trade instability forces Japanese enterprises to refrain from significant investments in development, and, if the situation worsens, they may begin the retrenchment.
Four-week-already “shutdown” is obstructing the strengthening of USD. Investors are waiting for increased negative effects from the partial suspension of government work. Failure of salaries payments to hundreds of thousands of employees may adversely affect retail sales. The purchasing power may also be reduced by the suspension of a number of socially significant government programs.
Support and resistance
The price forms the “Rising triangle” figure. If the instrument consolidates above the resistance level of 108.70, it may increase to 109.37 (Murrey [6/8], the midline of Bollinger Bands) and 110.93 (Murrey [7/8]). The level of 107.80 ([0/8]) still seems a key one for the "bears". Its breakdown will give the prospect of a decline to 107.00 (Murrey [1/8], H4) and 106.25 (Murrey [4/8]).
Technical indicators generally allow growth: MACD histogram is reducing in the negative zone, and Stochastic is reversing upwards.
Support levels: 107.80, 107.00, 106.25.
Resistance levels: 108.70, 109.37, 110.93.

Trading tips
Long positions may be opened if the instrument consolidates above 108.70 with targets at 109.37, 110.93 and stop loss at 108.30.
Short positions may be opened below 107.80 with targets at 107.00, 106.25 and stop loss at 108.20.
Implementation period: 3-5 days.
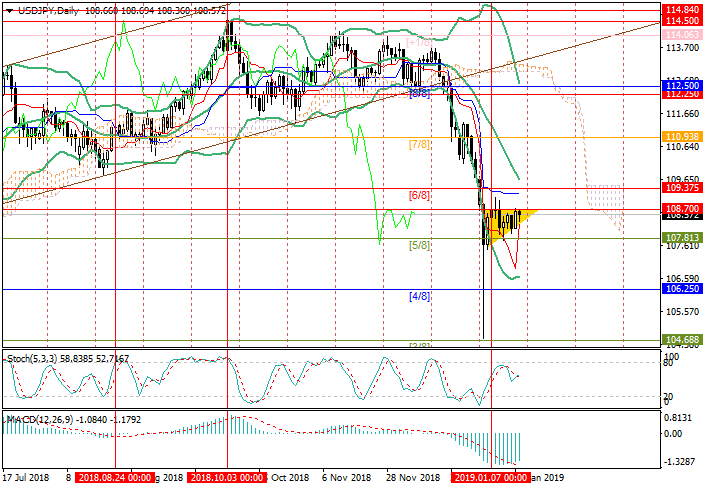
For the second week, the pair is consolidating within the range of 107.80-108.70.
Today, the yen is pressured by weak data on manufacturing orders, which are the main indicator of capital expenditures of Japanese companies. In November, the index was 0.0% instead of the expected growth of 3.1%. The volume of orders of enterprises in the industrial sector decreased by 6.4%, orders of public sector organizations - by 26.8%, and only orders from service companies grew by 2.5%. World trade instability forces Japanese enterprises to refrain from significant investments in development, and, if the situation worsens, they may begin the retrenchment.
Four-week-already “shutdown” is obstructing the strengthening of USD. Investors are waiting for increased negative effects from the partial suspension of government work. Failure of salaries payments to hundreds of thousands of employees may adversely affect retail sales. The purchasing power may also be reduced by the suspension of a number of socially significant government programs.
Support and resistance
The price forms the “Rising triangle” figure. If the instrument consolidates above the resistance level of 108.70, it may increase to 109.37 (Murrey [6/8], the midline of Bollinger Bands) and 110.93 (Murrey [7/8]). The level of 107.80 ([0/8]) still seems a key one for the "bears". Its breakdown will give the prospect of a decline to 107.00 (Murrey [1/8], H4) and 106.25 (Murrey [4/8]).
Technical indicators generally allow growth: MACD histogram is reducing in the negative zone, and Stochastic is reversing upwards.
Support levels: 107.80, 107.00, 106.25.
Resistance levels: 108.70, 109.37, 110.93.

Trading tips
Long positions may be opened if the instrument consolidates above 108.70 with targets at 109.37, 110.93 and stop loss at 108.30.
Short positions may be opened below 107.80 with targets at 107.00, 106.25 and stop loss at 108.20.
Implementation period: 3-5 days.


No comments:
Write comments