USD/JPY: ambiguous dynamics
15 January 2019, 08:44
| Scenario | |
|---|---|
| Timeframe | Intraday |
| Recommendation | BUY STOP |
| Entry Point | 109.15 |
| Take Profit | 110.45, 111.00 |
| Stop Loss | 108.50, 108.40 |
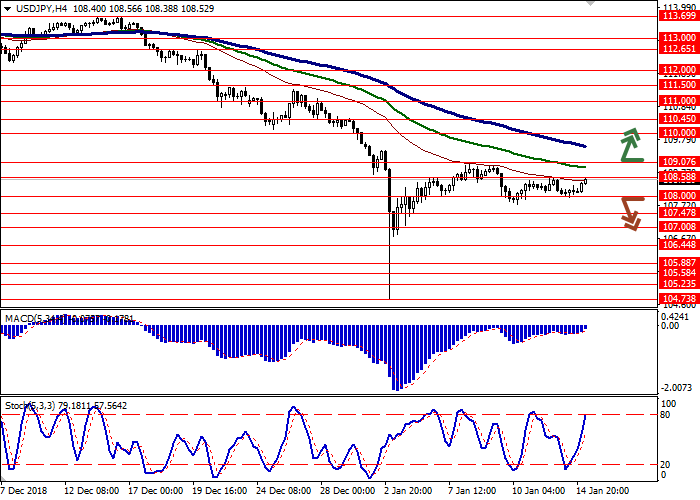
| Key Levels | 106.44, 107.00, 107.47, 108.00, 108.58, 109.07, 110.00, 110.45 |
| Alternative scenario | |
|---|---|
| Recommendation | SELL STOP |
| Entry Point | 107.95 |
| Take Profit | 107.00, 106.44 |
| Stop Loss | 108.58 |
| Key Levels | 106.44, 107.00, 107.47, 108.00, 108.58, 109.07, 110.00, 110.45 |
Current trend
Yesterday, USD fell against JPY, balancing the growth of the instrument at the end of last trading week. However, today, during the Asian session, USD managed to fully recover, returning to its local highs.
On Monday, the Japanese markets were closed due to Coming of Age Day, so investors focused on poor statistics from China. In December, export volumes unexpectedly fell by 4.4% YoY after rising by 5.4% YoY in November. Investors expected a positive trend of +3.0% YoY. For the same period, imports fell by 7.6% YoY against the expected growth of +5.0% YoY. Due to a sharp decline in import volumes, the trade surplus increased more strongly than expected – from $44.71 billion to $57.06 billion.
Support and resistance
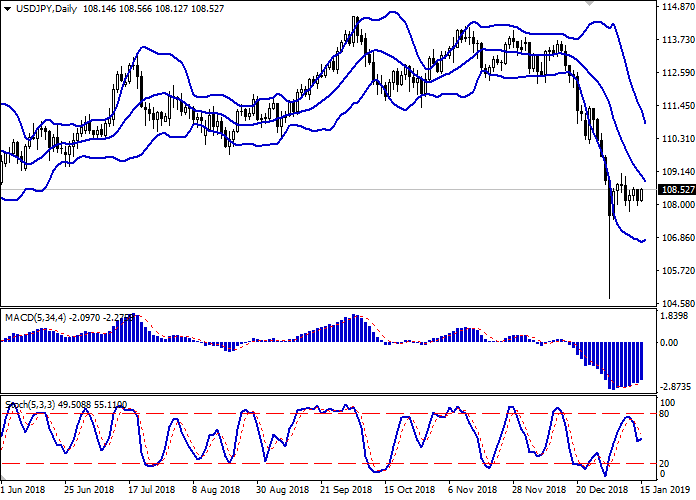
On the daily chart, Bollinger bands are steadily declining. The price range is actively narrowing, reflecting the emergence of flat trading dynamics in the short term. The MACD indicator is growing, keeping a strong buy signal (the histogram is above the signal line). Stochastic reversed horizontally after yesterday's short decline. Current readings of the indicator reflect an approximate balance of “bullish” and “bearish” moods in the super-short term.
The development of an upward trend is possible in the short and/or ultra-short term.
Resistance levels: 108.58, 109.07, 110.00, 110.45.
Support levels: 108.00, 107.47, 107.00, 106.44.


Trading tips
Long positions can be opened after the breakout of the level of 109.07 with the target at 110.45 or 111.00. Stop loss is 108.50–108.40.
Short positions can be opened after the breakdown of the level of 108.00 with the target at 107.00 or 106.44. Stop loss is 108.58.
Implementation period: 2–3 days.
Yesterday, USD fell against JPY, balancing the growth of the instrument at the end of last trading week. However, today, during the Asian session, USD managed to fully recover, returning to its local highs.
On Monday, the Japanese markets were closed due to Coming of Age Day, so investors focused on poor statistics from China. In December, export volumes unexpectedly fell by 4.4% YoY after rising by 5.4% YoY in November. Investors expected a positive trend of +3.0% YoY. For the same period, imports fell by 7.6% YoY against the expected growth of +5.0% YoY. Due to a sharp decline in import volumes, the trade surplus increased more strongly than expected – from $44.71 billion to $57.06 billion.
Support and resistance
On the daily chart, Bollinger bands are steadily declining. The price range is actively narrowing, reflecting the emergence of flat trading dynamics in the short term. The MACD indicator is growing, keeping a strong buy signal (the histogram is above the signal line). Stochastic reversed horizontally after yesterday's short decline. Current readings of the indicator reflect an approximate balance of “bullish” and “bearish” moods in the super-short term.
The development of an upward trend is possible in the short and/or ultra-short term.
Resistance levels: 108.58, 109.07, 110.00, 110.45.
Support levels: 108.00, 107.47, 107.00, 106.44.


Trading tips
Long positions can be opened after the breakout of the level of 109.07 with the target at 110.45 or 111.00. Stop loss is 108.50–108.40.
Short positions can be opened after the breakdown of the level of 108.00 with the target at 107.00 or 106.44. Stop loss is 108.58.
Implementation period: 2–3 days.


No comments:
Write comments