EUR/USD: general analysis
15 January 2019, 13:33
| Scenario | |
|---|---|
| Timeframe | Weekly |
| Recommendation | SELL STOP |
| Entry Point | 1.1405 |
| Take Profit | 1.1352 |
| Stop Loss | 1.1450 |
| Key Levels | 1.1352, 1.1413, 1.1474, 1.1535, 1.1596 |
| Alternative scenario | |
|---|---|
| Recommendation | BUY STOP |
| Entry Point | 1.1480 |
| Take Profit | 1.1535, 1.1596 |
| Stop Loss | 1.1430 |
| Key Levels | 1.1352, 1.1413, 1.1474, 1.1535, 1.1596 |
Current trend
Today, the EUR/USD pair continued to decline due to yesterday's poor data on China's trade. In December, instead of the expected growth, the volume of China's exports decreased by 4.4%, and the volume of imports fell by 7.6%, which may indicate a decline in the country's economy. However, the trade surplus in China’s trade with the US increased by 17% against last year and reached $323.32 billion (the highest figure since 2006), despite the introduction of increased duties by Washington, which does not preclude the introduction of new US economic sanctions against Chinese producers.
Meanwhile, the Shutdown in the US continues. Yesterday, President Trump rejected Senator Lindsay Graham’s proposal to temporarily resume government work for three weeks and try to negotiate with the Democrats. Thus, the situation remains uncertain.
In the evening, the ECB Head Mario Draghi Speech is expected in Strasbourg. Statements by officials of such a high rank attract investors’ attention, since it may contain hints on the next steps in monetary policy.
Support and resistance
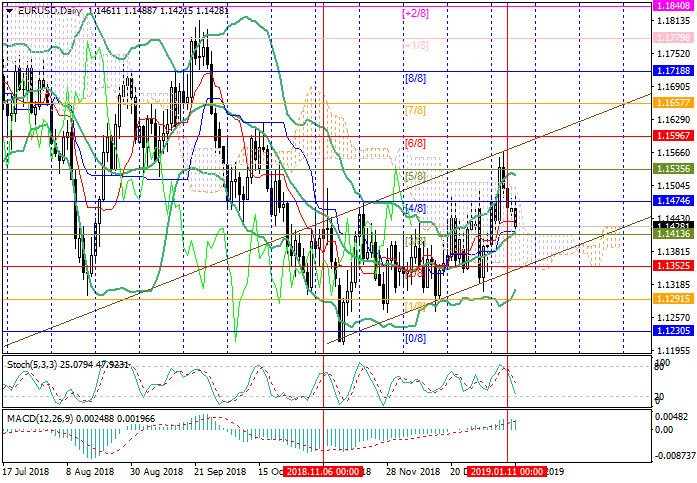
The pair dropped to 1.1413 (the middle line of Bollinger bands, Murrey [3/8]). Its breakdown will let it fall to the lower border of the upward channel around 1.1352 (Murrey [2/8]). The key “bullish” level is 1.1474 (Murrey [4/8]). After its breakdown, the growth to 1.1535 (Murrey [5/8]) and 1.1596 (Murrey [6/8]) is possible.
Technical indicators allow price reduction. MACD histogram is decreasing in the positive zone. Stochastic is pointed downwards.
Resistance levels: 1.1474, 1.1535, 1.1596.
Support levels: 1.1413, 1.1352.

Trading tips
Short positions can be opened below 1.1413 with the target at 1.1352 and stop loss 1.1450.
Long positions can be opened after the price fixes above 1.1474 with the targets at 1.1535, 1.1596 and stop loss around 1.1430.
Implementation period: 4–5 days.
Today, the EUR/USD pair continued to decline due to yesterday's poor data on China's trade. In December, instead of the expected growth, the volume of China's exports decreased by 4.4%, and the volume of imports fell by 7.6%, which may indicate a decline in the country's economy. However, the trade surplus in China’s trade with the US increased by 17% against last year and reached $323.32 billion (the highest figure since 2006), despite the introduction of increased duties by Washington, which does not preclude the introduction of new US economic sanctions against Chinese producers.
Meanwhile, the Shutdown in the US continues. Yesterday, President Trump rejected Senator Lindsay Graham’s proposal to temporarily resume government work for three weeks and try to negotiate with the Democrats. Thus, the situation remains uncertain.
In the evening, the ECB Head Mario Draghi Speech is expected in Strasbourg. Statements by officials of such a high rank attract investors’ attention, since it may contain hints on the next steps in monetary policy.
Support and resistance
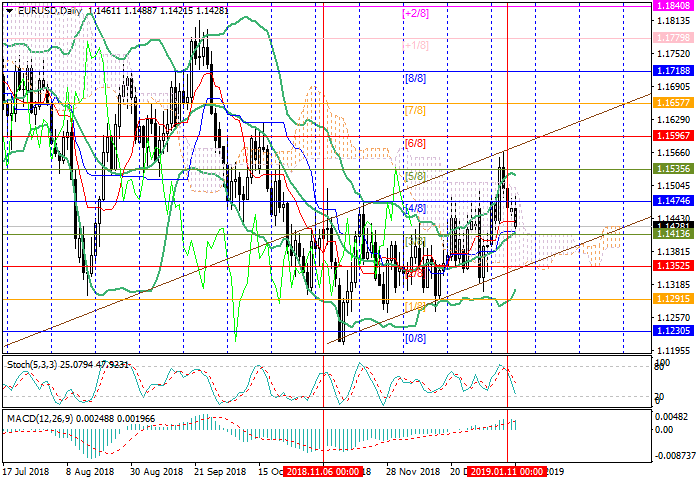
The pair dropped to 1.1413 (the middle line of Bollinger bands, Murrey [3/8]). Its breakdown will let it fall to the lower border of the upward channel around 1.1352 (Murrey [2/8]). The key “bullish” level is 1.1474 (Murrey [4/8]). After its breakdown, the growth to 1.1535 (Murrey [5/8]) and 1.1596 (Murrey [6/8]) is possible.
Technical indicators allow price reduction. MACD histogram is decreasing in the positive zone. Stochastic is pointed downwards.
Resistance levels: 1.1474, 1.1535, 1.1596.
Support levels: 1.1413, 1.1352.

Trading tips
Short positions can be opened below 1.1413 with the target at 1.1352 and stop loss 1.1450.
Long positions can be opened after the price fixes above 1.1474 with the targets at 1.1535, 1.1596 and stop loss around 1.1430.
Implementation period: 4–5 days.


No comments:
Write comments