Brent Crude Oil: downward trend continues
15 January 2019, 12:53
| Scenario | |
|---|---|
| Timeframe | Weekly |
| Recommendation | SELL |
| Entry Point | 59.28 |
| Take Profit | 50.00, 45.85, 44.15 |
| Stop Loss | 65.00 |
| Key Levels | 44.15, 45.85, 50.00, 50.50, 52.00, 53.20, 54.15, 56.30, 57.70, 58.50, 61.45, 63.50, 64.45, 65.00, 68.30, 71.00, 74.30 |
| Alternative scenario | |
|---|---|
| Recommendation | SELL LIMIT |
| Entry Point | 62.35, 63.50 |
| Take Profit | 50.00, 45.85, 44.15 |
| Stop Loss | 65.00 |
| Key Levels | 44.15, 45.85, 50.00, 50.50, 52.00, 53.20, 54.15, 56.30, 57.70, 58.50, 61.45, 63.50, 64.45, 65.00, 68.30, 71.00, 74.30 |
Current trend
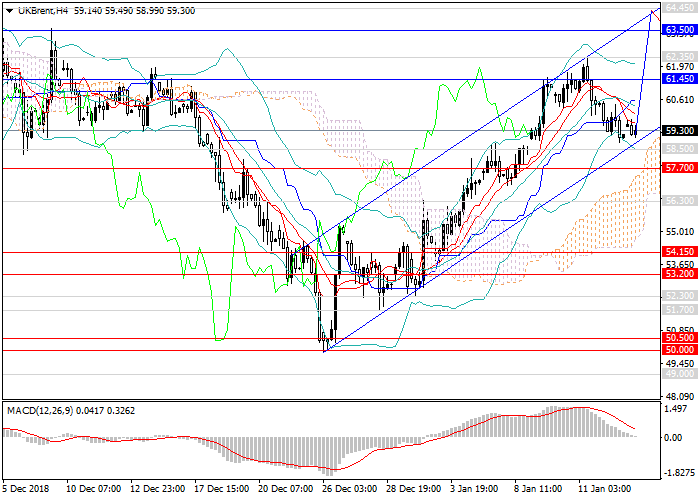
The rapid fall in oil prices was replaced by an upward correction from the level of $50 per barrel. At the beginning of this year, "black gold" rose almost by $10 per barrel. The main catalyst was the decline in the US currency, as well as technical growth in demand for the oversold asset. The instrument stopped at the level of 62.35 and decreased to the levels of 59.00, 59.50. At the moment, a new upward trend is forming.
This week, traders will pay attention to data on major indices, Retail Sales and Industrial Production in the United States.
Support and resistance
The probability of maintenance of the upward momentum with the target at 63.50 (the local maximum of the beginning of December 2018) is great. Further, the price may reverse into sideways consolidation within the wide channel 63.50–57.70, and then begin to decline to new lows due to oversaturation of the market and falling demand. In the long term, the targets can be the levels of 45.85, 44.15.
Technical indicators continue to give a sell signal: MACD keeps high volumes of short positions, and Bollinger bands are directed downwards.
Resistance levels: 61.45, 63.50, 64.45, 65.00, 68.30, 71.00, 74.30.
Support levels: 58.50, 57.70, 56.30, 54.15, 53.20, 52.00, 50.50, 50.00, 45.85, 44.15.

Trading tips
It is relevant to increase volumes of short positions from the current level and open pending positions from the levels of 62.35, 63.50 with the targets at 50.00, 45.85, 44.15 and stop loss 65.00.
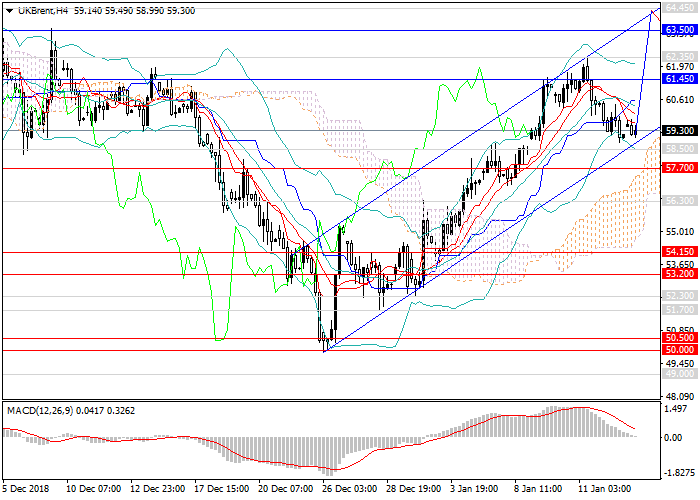
The rapid fall in oil prices was replaced by an upward correction from the level of $50 per barrel. At the beginning of this year, "black gold" rose almost by $10 per barrel. The main catalyst was the decline in the US currency, as well as technical growth in demand for the oversold asset. The instrument stopped at the level of 62.35 and decreased to the levels of 59.00, 59.50. At the moment, a new upward trend is forming.
This week, traders will pay attention to data on major indices, Retail Sales and Industrial Production in the United States.
Support and resistance
The probability of maintenance of the upward momentum with the target at 63.50 (the local maximum of the beginning of December 2018) is great. Further, the price may reverse into sideways consolidation within the wide channel 63.50–57.70, and then begin to decline to new lows due to oversaturation of the market and falling demand. In the long term, the targets can be the levels of 45.85, 44.15.
Technical indicators continue to give a sell signal: MACD keeps high volumes of short positions, and Bollinger bands are directed downwards.
Resistance levels: 61.45, 63.50, 64.45, 65.00, 68.30, 71.00, 74.30.
Support levels: 58.50, 57.70, 56.30, 54.15, 53.20, 52.00, 50.50, 50.00, 45.85, 44.15.

Trading tips
It is relevant to increase volumes of short positions from the current level and open pending positions from the levels of 62.35, 63.50 with the targets at 50.00, 45.85, 44.15 and stop loss 65.00.


No comments:
Write comments