AUD/USD: the instrument is trading in both directions
16 January 2019, 08:22
| Scenario | |
|---|---|
| Timeframe | Intraday |
| Recommendation | BUY STOP |
| Entry Point | 0.7250 |
| Take Profit | 0.7300, 0.7320, 0.7350 |
| Stop Loss | 0.7200 |
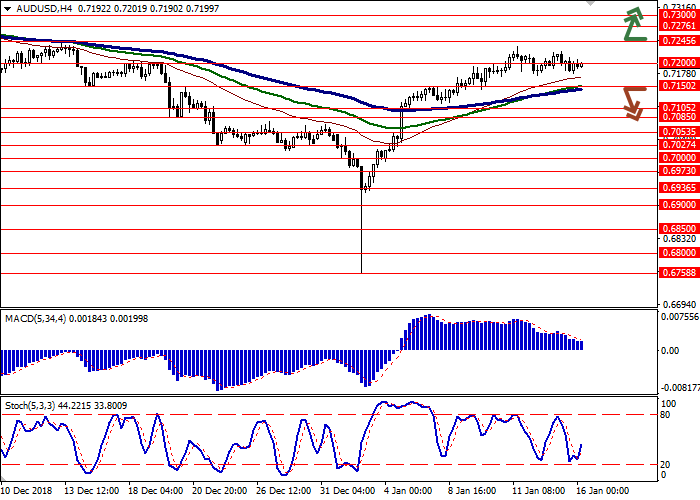
| Key Levels | 0.7085, 0.7105, 0.7150, 0.7200, 0.7245, 0.7276, 0.7300 |
| Alternative scenario | |
|---|---|
| Recommendation | SELL STOP |
| Entry Point | 0.7145 |
| Take Profit | 0.7053, 0.7027, 0.7000 |
| Stop Loss | 0.7200 |
| Key Levels | 0.7085, 0.7105, 0.7150, 0.7200, 0.7245, 0.7276, 0.7300 |
Current trend
AUD shows a flat trend against USD since the beginning of the current trading week, remaining in the area of local highs of December 13.
AUD is still pressured by negative data on Chinese trade. Weak exports and imports are complemented by an increase in trade surplus in China’s trade with the United States. Despite the introduction of increased duties by Washington, it grew by 17% compared with last year and reached USD 323.32B (the highest figure since 2006). This situation does not preclude the introduction of new US economic sanctions against Chinese manufacturers or a tightening of the US position in trade negotiations.
Today, AUD is under pressure from weak Westpac Consumer Sentiment data. In January, the index collapsed by 4.7% MoM after rising by 0.1% last month.
Support and resistance
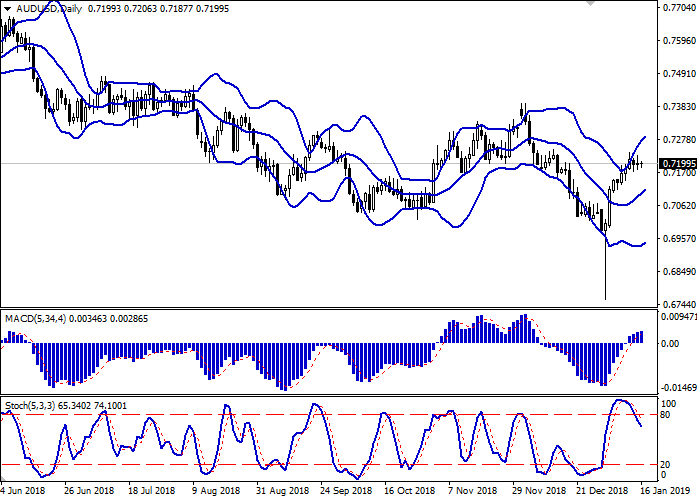
Bollinger Bands in D1 chart show moderate growth. The price range is still prone to widening, freeing the path to new local highs for the "bulls". MACD indicator is growing keeping quite stable buy signal (located above the signal line). Stochastic keeps a downtrend, signaling the risks associated with the overbought AUD in the short and/or ultra-short term.
It is necessary to wait for clarification of the situation in the market to open new positions.
Resistance levels: 0.7245, 0.7276, 0.7300.
Support levels: 0.7200, 0.7150, 0.7105, 0.7085.


Trading tips
To open long positions, one can rely on the breakout of 0.7245. Take profit — 0.7300 or 0.7320, 0.7350. Stop loss — 0.7200.
The return of "bearish" trend with the breakdown of 0.7150 may become a signal for new sales with the target at 0.7053 or 0.7027, 0.7000. Stop loss — 0.7200.
Implementation period: 2-3 days.
AUD shows a flat trend against USD since the beginning of the current trading week, remaining in the area of local highs of December 13.
AUD is still pressured by negative data on Chinese trade. Weak exports and imports are complemented by an increase in trade surplus in China’s trade with the United States. Despite the introduction of increased duties by Washington, it grew by 17% compared with last year and reached USD 323.32B (the highest figure since 2006). This situation does not preclude the introduction of new US economic sanctions against Chinese manufacturers or a tightening of the US position in trade negotiations.
Today, AUD is under pressure from weak Westpac Consumer Sentiment data. In January, the index collapsed by 4.7% MoM after rising by 0.1% last month.
Support and resistance
Bollinger Bands in D1 chart show moderate growth. The price range is still prone to widening, freeing the path to new local highs for the "bulls". MACD indicator is growing keeping quite stable buy signal (located above the signal line). Stochastic keeps a downtrend, signaling the risks associated with the overbought AUD in the short and/or ultra-short term.
It is necessary to wait for clarification of the situation in the market to open new positions.
Resistance levels: 0.7245, 0.7276, 0.7300.
Support levels: 0.7200, 0.7150, 0.7105, 0.7085.


Trading tips
To open long positions, one can rely on the breakout of 0.7245. Take profit — 0.7300 or 0.7320, 0.7350. Stop loss — 0.7200.
The return of "bearish" trend with the breakdown of 0.7150 may become a signal for new sales with the target at 0.7053 or 0.7027, 0.7000. Stop loss — 0.7200.
Implementation period: 2-3 days.


No comments:
Write comments