
Bitcoin: technical analysis
28 January 2019, 13:12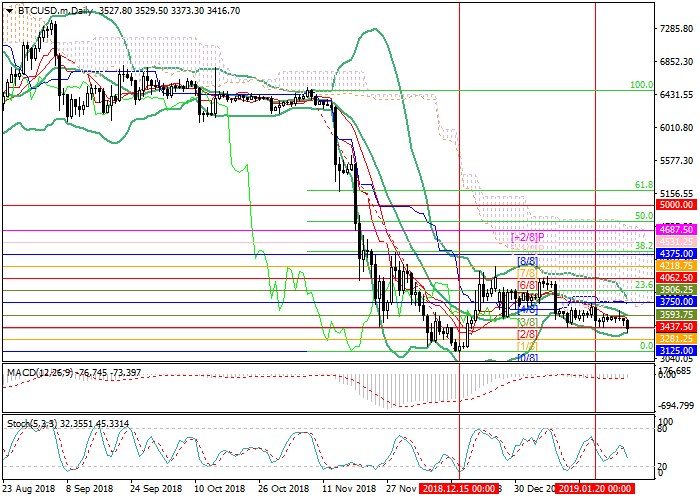
| Scenario | |
|---|---|
| Timeframe | Weekly |
| Recommendation | SELL STOP |
| Entry Point | 3400.00 |
| Take Profit | 3281.25, 3125.00 |
| Stop Loss | 3550.00 |
| Key Levels | 3125.00, 3281.25, 3437.50, 3593.75, 3750.00, 3906.25 |
| Alternative scenario | |
|---|---|
| Recommendation | BUY STOP |
| Entry Point | 3620.00 |
| Take Profit | 3750.00, 3906.25 |
| Stop Loss | 3500.00 |
| Key Levels | 3125.00, 3281.25, 3437.50, 3593.75, 3750.00, 3906.25 |
Current trend
Last week, Bitcoin was trading within the main range of 3593.75–3437.50 (Murrey [3/8]–[2/8]) and unsuccessfully tested its upper limit more than once. However, today the price fell to the level of 3437.50, and in the case of consolidation below it, the weakening may continue to the levels of 3281.25 (Murrey [1/8]) and 3125.00 (Murrey [0/8], December’s low).
This scenario is confirmed by technical indicators: the Bollinger and Stochastic bands are reversing downwards; MACD histogram is stable in the negative zone. The key “bullish” level is 3593.75 near the middle line of Bollinger bands. If the price consolidates above it, growth to the levels of 3750.00 (Murrey [4/8]) and 3906.25 (Murrey [5/8], Fibonacci correction 23.6%) may start but now this scenario seems less likely.
Support and resistance
Resistance levels: 3593.75, 3750.00, 3906.25.
Support levels: 3437.50, 3281.25, 3125.00.

Trading tips
Short positions can be opened after the price fixes below the level of 3437.50 with the targets at 3281.25, 3125.00 and stop loss in the area of 3550.00.
Long positions can be opened after the price consolidates above the level of 3593.75 with the targets at 3750.00 and 3906.25. Stop loss is around 3500.00.
Implementation period: 4–5 days.
Last week, Bitcoin was trading within the main range of 3593.75–3437.50 (Murrey [3/8]–[2/8]) and unsuccessfully tested its upper limit more than once. However, today the price fell to the level of 3437.50, and in the case of consolidation below it, the weakening may continue to the levels of 3281.25 (Murrey [1/8]) and 3125.00 (Murrey [0/8], December’s low).
This scenario is confirmed by technical indicators: the Bollinger and Stochastic bands are reversing downwards; MACD histogram is stable in the negative zone. The key “bullish” level is 3593.75 near the middle line of Bollinger bands. If the price consolidates above it, growth to the levels of 3750.00 (Murrey [4/8]) and 3906.25 (Murrey [5/8], Fibonacci correction 23.6%) may start but now this scenario seems less likely.
Support and resistance
Resistance levels: 3593.75, 3750.00, 3906.25.
Support levels: 3437.50, 3281.25, 3125.00.
Trading tips
Short positions can be opened after the price fixes below the level of 3437.50 with the targets at 3281.25, 3125.00 and stop loss in the area of 3550.00.
Long positions can be opened after the price consolidates above the level of 3593.75 with the targets at 3750.00 and 3906.25. Stop loss is around 3500.00.
Implementation period: 4–5 days.


No comments:
Write comments