
Verizon Communications Inc. (VZ/NYSE): general analysis
28 January 2019, 11:12
| Scenario | |
|---|---|
| Timeframe | Intraday |
| Recommendation | SELL STOP |
| Entry Point | 56.25 |
| Take Profit | 55.00, 54.00, 53.00 |
| Stop Loss | 56.65, 57.50 |
| Key Levels | 53.00, 55.00, 56.25, 58.00, 59.00, 60.50 |
| Alternative scenario | |
|---|---|
| Recommendation | BUY STOP |
| Entry Point | 58.00 |
| Take Profit | 60.00, 61.00 |
| Stop Loss | 57.00 |
| Key Levels | 53.00, 55.00, 56.25, 58.00, 59.00, 60.50 |
Current trend
In the second half of January, Verizon shares lost 2.8% of its value. Now the stocks are currently trading at a premium of 2.2% to the monthly minimum. Since the November 52-week high, the price has decreased by more than 7.5%. Tomorrow, before the market opens, 2018 Q4 financial results will be published. Previously, the company's management announced a reduction in staff of the media line by 7% as part of a cost reduction program.
During the last week, Verizon decreased by 0.76% against the growth of S&P 500 index by 1.07%.
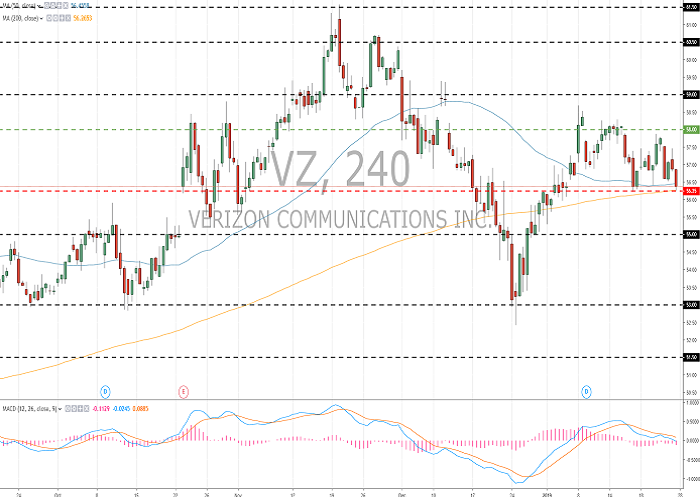
Support and resistance
The company’s shares have developed an ambiguous technical picture. The issuer is trading flat. The instrument is testing local support and resistance levels at 56.25 and 58.00. After a protracted rally, there is a potential for a correction. Indicators do not give accurate signals: the price crossed the MA (50) and MA (200); MACD histogram began to decline. It is better to open the positions from the key levels.
Comparative analysis of multipliers of the company and competing companies in the industry indicates the neutrality of the instrument.
Resistance levels: 58.00, 59.00, 60.50.
Support levels: 56.25, 55.00, 53.00.
Trading tips
Short positions can be opened after the price is set below the level of 56.25. The closing of the profitable positions is possible at the levels of 55.00, 54.00 and 53.00. Stop loss is 57.50.
Long positions can be opened after the price is fixed above the level of 58.00 with the targets at 60.00–61.00. Stop loss is 57.00.
Implementation period: 3 days.
In the second half of January, Verizon shares lost 2.8% of its value. Now the stocks are currently trading at a premium of 2.2% to the monthly minimum. Since the November 52-week high, the price has decreased by more than 7.5%. Tomorrow, before the market opens, 2018 Q4 financial results will be published. Previously, the company's management announced a reduction in staff of the media line by 7% as part of a cost reduction program.
During the last week, Verizon decreased by 0.76% against the growth of S&P 500 index by 1.07%.
Support and resistance
The company’s shares have developed an ambiguous technical picture. The issuer is trading flat. The instrument is testing local support and resistance levels at 56.25 and 58.00. After a protracted rally, there is a potential for a correction. Indicators do not give accurate signals: the price crossed the MA (50) and MA (200); MACD histogram began to decline. It is better to open the positions from the key levels.
Comparative analysis of multipliers of the company and competing companies in the industry indicates the neutrality of the instrument.
Resistance levels: 58.00, 59.00, 60.50.
Support levels: 56.25, 55.00, 53.00.
Trading tips
Short positions can be opened after the price is set below the level of 56.25. The closing of the profitable positions is possible at the levels of 55.00, 54.00 and 53.00. Stop loss is 57.50.
Long positions can be opened after the price is fixed above the level of 58.00 with the targets at 60.00–61.00. Stop loss is 57.00.
Implementation period: 3 days.


No comments:
Write comments