
WTI Crude Oil: general review
28 January 2019, 13:15
| Scenario | |
|---|---|
| Timeframe | Intraday |
| Recommendation | BUY LIMIT |
| Entry Point | 51.83 |
| Take Profit | 52.85 |
| Stop Loss | 51.45 |
| Key Levels | 47.32, 48.66, 50.40, 51.83, 52.85, 53.80, 55.20, 56.70 |
| Alternative scenario | |
|---|---|
| Recommendation | SELL STOP |
| Entry Point | 51.65 |
| Take Profit | 50.90 |
| Stop Loss | 51.95 |
| Key Levels | 47.32, 48.66, 50.40, 51.83, 52.85, 53.80, 55.20, 56.70 |
Current trend
On Monday, WTI crude oil moderately decreased amid rising drilling activity in the United States.
Last Friday, Baker Hughes reported an increase in the number of active drilling rigs in the United States by 10 units over the week. Currently, US oil companies have 862 active rigs. In addition, the instrument was pressured moderately by a reduction in profits of Chinese industrial companies. The continuing weakness of the PRC economy may cause a significant reduction in the volume of oil purchases.
Tomorrow at 22:30 (GMT+2), an API report on US oil reserves is expected to be published. Reduction of stocks will help restore the instrument to the level of 55.00. Also, investors continue to follow the course of negotiations between the United States and China.
Support and resistance
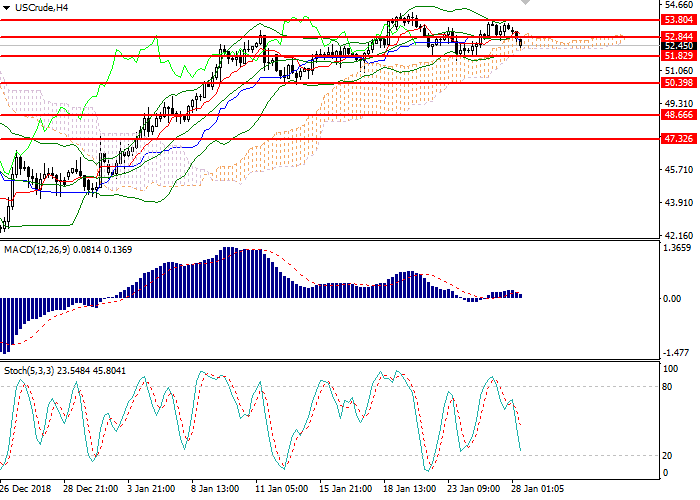
On H4 chart, the price has consolidated below the strong level of 52.85 and continued to decline. Bollinger Bands are directed horizontally, and the price range remains limited, which indicates a continuation of the corrective dynamics. MACD histogram is corrected near zero line. Stochastic is preparing to enter the oversold area, so a buy signal can be formed in 1-2 days.
Support levels: 51.83, 50.40, 48.66, 47.32.
Resistance levels: 52.85, 53.80, 55.20, 56.70.
Trading tips
Long positions may be opened from the level of 51.83 with targets at 52.85 and stop-loss at 51.45. Implementation period: 1-2 days.
Short positions may be opened below 51.70 with the target at 50.90 and stop loss at 51.95. Implementation period: 1-3 days.
On Monday, WTI crude oil moderately decreased amid rising drilling activity in the United States.
Last Friday, Baker Hughes reported an increase in the number of active drilling rigs in the United States by 10 units over the week. Currently, US oil companies have 862 active rigs. In addition, the instrument was pressured moderately by a reduction in profits of Chinese industrial companies. The continuing weakness of the PRC economy may cause a significant reduction in the volume of oil purchases.
Tomorrow at 22:30 (GMT+2), an API report on US oil reserves is expected to be published. Reduction of stocks will help restore the instrument to the level of 55.00. Also, investors continue to follow the course of negotiations between the United States and China.
Support and resistance
On H4 chart, the price has consolidated below the strong level of 52.85 and continued to decline. Bollinger Bands are directed horizontally, and the price range remains limited, which indicates a continuation of the corrective dynamics. MACD histogram is corrected near zero line. Stochastic is preparing to enter the oversold area, so a buy signal can be formed in 1-2 days.
Support levels: 51.83, 50.40, 48.66, 47.32.
Resistance levels: 52.85, 53.80, 55.20, 56.70.
Trading tips
Long positions may be opened from the level of 51.83 with targets at 52.85 and stop-loss at 51.45. Implementation period: 1-2 days.
Short positions may be opened below 51.70 with the target at 50.90 and stop loss at 51.95. Implementation period: 1-3 days.


No comments:
Write comments