
XAG/USD: the price consolidates
07 December 2018, 09:24
| Scenario | |
|---|---|
| Timeframe | Intraday |
| Recommendation | BUY STOP |
| Entry Point | 14.53 |
| Take Profit | 14.78, 14.88 |
| Stop Loss | 14.39 |
| Key Levels | 14.00, 14.13, 14.20, 14.31, 14.39, 14.51, 14.63, 14.78, 14.88, 15.00 |
| Alternative scenario | |
|---|---|
| Recommendation | SELL STOP |
| Entry Point | 14.28 |
| Take Profit | 14.13, 14.00 |
| Stop Loss | 14.45 |
| Key Levels | 14.00, 14.13, 14.20, 14.31, 14.39, 14.51, 14.63, 14.78, 14.88, 15.00 |
Current trend
Yesterday, silver prices declined, developing Wednesday’s “bearish” impulse. However, in the evening, the instrument restored some of the losses, and during today’s Asian session, silver is growing.
USD is under pressure of the Fed's Beige Book release, which recorded a slowdown in the American economy. Most regions (11 out of 12) name the taxes increases and the general Trumps’ trade policy as the reasons for the recession. After Powell’s recent statements that the rate is "just below" the neutral level, the market fears a slowdown in the tightening of monetary policy. Also, the arrest of the financial director of Chinese company Huawei Meng Wanzhou in Canada at the US request may jeopardize the implementation of the Xi Jinping and Donald Trump G20 agreements. The Chinese authorities expressed protest and demanded the immediate release of Meng Wanzhou.
Today traders wait for US November Unemployment Rate, which is expected to stay at 3.7%, and Nonfarm Payrolls, which may decrease from 250K to 200K.
Support and resistance
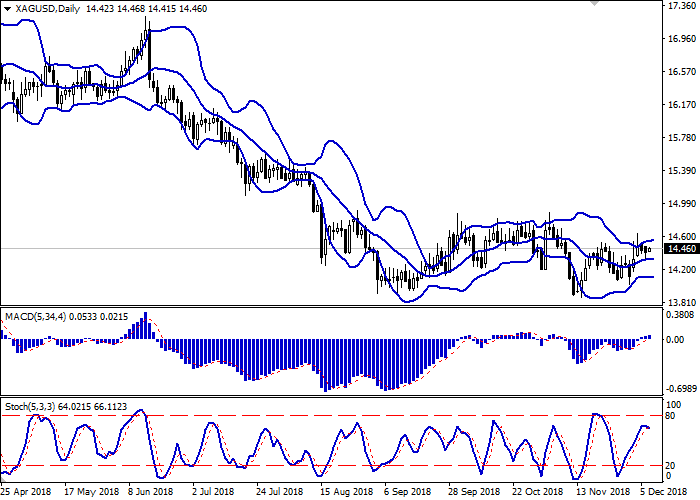
On the daily chart, Bollinger bands are moving horizontally. The price range is slightly extended from the top. The MACD indicator is growing, keeping a weak buy signal (the histogram is above the signal line). Stochastic reverses horizontally after a long period of growth to its highs.
The indicators’ readings do not contradict the resumption of active growth in the short and/or super short term.
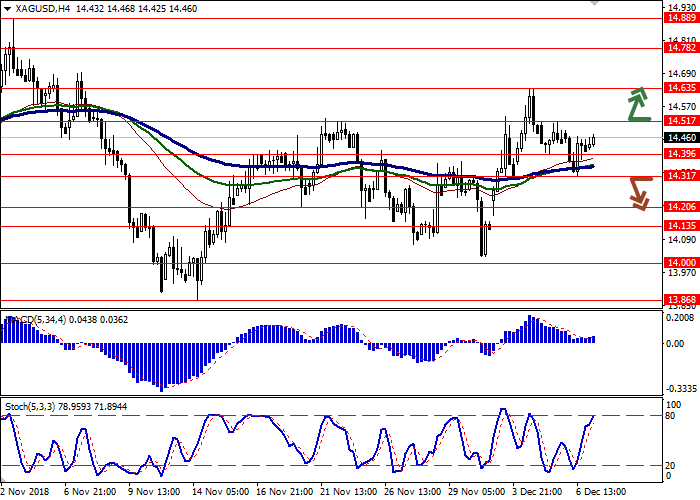
Resistance levels: 14.51, 14.63, 14.78, 14.88, 15.00.
Support levels: 14.39, 14.31, 14.20, 14.13, 14.00.
Trading tips
Long positions can be opened after the breakout of 14.51 with the target at 14.78 or 14.88. Stop loss is 14.39.
Short positions can be opened after the breakdown of 14.31 with the target at 14.13 or 14.00. Stop loss is 14.45.
Implementation period: 2–3 days.
Yesterday, silver prices declined, developing Wednesday’s “bearish” impulse. However, in the evening, the instrument restored some of the losses, and during today’s Asian session, silver is growing.
USD is under pressure of the Fed's Beige Book release, which recorded a slowdown in the American economy. Most regions (11 out of 12) name the taxes increases and the general Trumps’ trade policy as the reasons for the recession. After Powell’s recent statements that the rate is "just below" the neutral level, the market fears a slowdown in the tightening of monetary policy. Also, the arrest of the financial director of Chinese company Huawei Meng Wanzhou in Canada at the US request may jeopardize the implementation of the Xi Jinping and Donald Trump G20 agreements. The Chinese authorities expressed protest and demanded the immediate release of Meng Wanzhou.
Today traders wait for US November Unemployment Rate, which is expected to stay at 3.7%, and Nonfarm Payrolls, which may decrease from 250K to 200K.
Support and resistance
On the daily chart, Bollinger bands are moving horizontally. The price range is slightly extended from the top. The MACD indicator is growing, keeping a weak buy signal (the histogram is above the signal line). Stochastic reverses horizontally after a long period of growth to its highs.
The indicators’ readings do not contradict the resumption of active growth in the short and/or super short term.
Resistance levels: 14.51, 14.63, 14.78, 14.88, 15.00.
Support levels: 14.39, 14.31, 14.20, 14.13, 14.00.
Trading tips
Long positions can be opened after the breakout of 14.51 with the target at 14.78 or 14.88. Stop loss is 14.39.
Short positions can be opened after the breakdown of 14.31 with the target at 14.13 or 14.00. Stop loss is 14.45.
Implementation period: 2–3 days.


No comments:
Write comments