
WTI Crude Oil: oil prices are going down
07 December 2018, 09:28
| Scenario | |
|---|---|
| Timeframe | Intraday |
| Recommendation | BUY STOP |
| Entry Point | 52.45, 53.35 |
| Take Profit | 55.64, 57.00 |
| Stop Loss | 51.00 |
| Key Levels | 47.00, 48.09, 49.00, 50.00, 52.38, 53.30, 54.43, 55.64 |
| Alternative scenario | |
|---|---|
| Recommendation | SELL STOP |
| Entry Point | 49.90 |
| Take Profit | 48.09, 47.00 |
| Stop Loss | 51.50 |
| Key Levels | 47.00, 48.09, 49.00, 50.00, 52.38, 53.30, 54.43, 55.64 |
Current trend
WTI crude oil price showed a decline on Thursday, updating local lows of November 30. However, by the end of yesterday's trading session, the instrument managed to recover a significant part of its losses, which was associated with the publication of weak data from the US.
In particular, investors reacted negatively to the publication of the ADP Nonfarm Employment Change. In December, the figure rose by only 179K, after rising by 225K last month, with a forecast of 195K.
In turn, the WTI quotes are pressured because of the OPEC agreement to reduce production in the first half of 2019 by about 1 million barrels per day. Investors consider such a reduction insufficient, regarding the risk of disrupting the US-Chinese trade truce. In addition, Iran is willing to leave the OPEC+ treaty. Iranian Oil Minister Bijan Zanganeh said that the country will not participate in the agreement and will not reduce production until the US sanctions are lifted.
Support and resistance
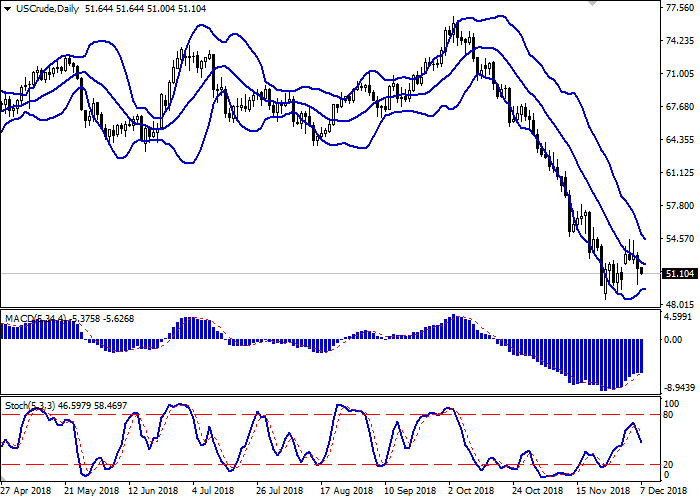
On the D1 chart, Bollinger Bands are gradually reversing horizontally. The price range is narrowing, reflecting ambiguous nature of trading in recent weeks. MACD is gradually reversing downwards keeping a previous buy signal (located above the signal line). Stochastic is going down steadily and is located in the middle of its area.
It is necessary to wait for the trade signals from technical indicators to become clear.
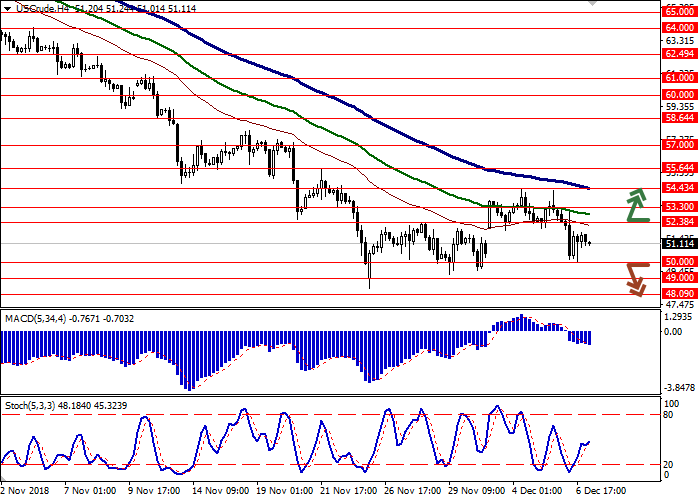
Resistance levels: 52.38, 53.30, 54.43, 55.64.
Support levels: 50.00, 49.00, 48.09, 47.00.
Trading tips
To open long positions, one can rely on the breakout of 52.38 or 53.30. Take profit — 55.64 or 57.00. Stop loss — 51.00.
A breakdown of 50.00 may be a signal to further sales with target at 48.09 or 47.00. Stop loss — 51.50.
Implementation period: 2-3 days.
WTI crude oil price showed a decline on Thursday, updating local lows of November 30. However, by the end of yesterday's trading session, the instrument managed to recover a significant part of its losses, which was associated with the publication of weak data from the US.
In particular, investors reacted negatively to the publication of the ADP Nonfarm Employment Change. In December, the figure rose by only 179K, after rising by 225K last month, with a forecast of 195K.
In turn, the WTI quotes are pressured because of the OPEC agreement to reduce production in the first half of 2019 by about 1 million barrels per day. Investors consider such a reduction insufficient, regarding the risk of disrupting the US-Chinese trade truce. In addition, Iran is willing to leave the OPEC+ treaty. Iranian Oil Minister Bijan Zanganeh said that the country will not participate in the agreement and will not reduce production until the US sanctions are lifted.
Support and resistance
On the D1 chart, Bollinger Bands are gradually reversing horizontally. The price range is narrowing, reflecting ambiguous nature of trading in recent weeks. MACD is gradually reversing downwards keeping a previous buy signal (located above the signal line). Stochastic is going down steadily and is located in the middle of its area.
It is necessary to wait for the trade signals from technical indicators to become clear.
Resistance levels: 52.38, 53.30, 54.43, 55.64.
Support levels: 50.00, 49.00, 48.09, 47.00.
Trading tips
To open long positions, one can rely on the breakout of 52.38 or 53.30. Take profit — 55.64 or 57.00. Stop loss — 51.00.
A breakdown of 50.00 may be a signal to further sales with target at 48.09 or 47.00. Stop loss — 51.50.
Implementation period: 2-3 days.


No comments:
Write comments