
EUR/USD: the pair is trading in different directions
07 December 2018, 08:55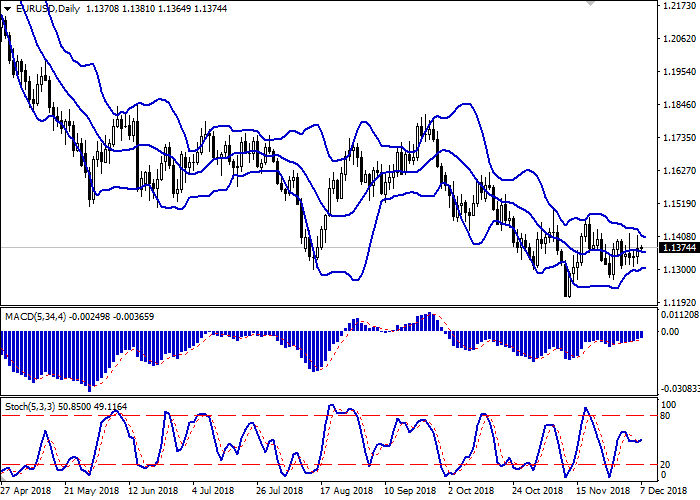
| Scenario | |
|---|---|
| Timeframe | Intraday |
| Recommendation | BUY STOP |
| Entry Point | 1.1405 |
| Take Profit | 1.1460, 1.1470 |
| Stop Loss | 1.1370 |
| Key Levels | 1.1266, 1.1300, 1.1325, 1.1357, 1.1400, 1.1432, 1.1460, 1.1500 |
| Alternative scenario | |
|---|---|
| Recommendation | SELL STOP |
| Entry Point | 1.1365 |
| Take Profit | 1.1325, 1.1300 |
| Stop Loss | 1.1400 |
| Key Levels | 1.1266, 1.1300, 1.1325, 1.1357, 1.1400, 1.1432, 1.1460, 1.1500 |
Current trend
Yesterday, EUR rose against USD, recovering slightly after the mixed trade dynamics on Tuesday and Wednesday.
Investors are focused on the situation around the arrest of Meng Wanzhou, the CFO of Huawei, accused of collaborating with Iran bypassing US sanctions. If she is sent to the United States, the 90-day truce may be broken, and further negotiations will be questionable. The case is complicated by the fact that Huawei is the leader in developing technologies that make the PRC less dependent on American and European suppliers, and the Chinese authorities will probably not leave the arrest of the company's leading manager without consequences.
On Friday, data on the Eurozone GDP in Q3 2018 will be published. Indicators are expected to remain the same. QoQ, GDP growth will be 0.2%, and YoY – 1.7%.
Support and resistance
On the daily chart, Bollinger bands are moving horizontally. The price range narrows from above, reflecting the flat nature of trading last week. The MACD indicator is growing, keeping a weak buy signal (the histogram is above the signal line). After a brief horizontal movement, Stochastic reverses upwards up again, responding to yesterday's strengthening of “bullish” moods.
It is better to keep current long positions in the short and/or super short term. It is better to wait for the appearance of additional trading signals before opening new positions.
Resistance levels: 1.1400, 1.1432, 1.1460, 1.1500.
Support levels: 1.1357, 1.1325, 1.1300, 1.1266.
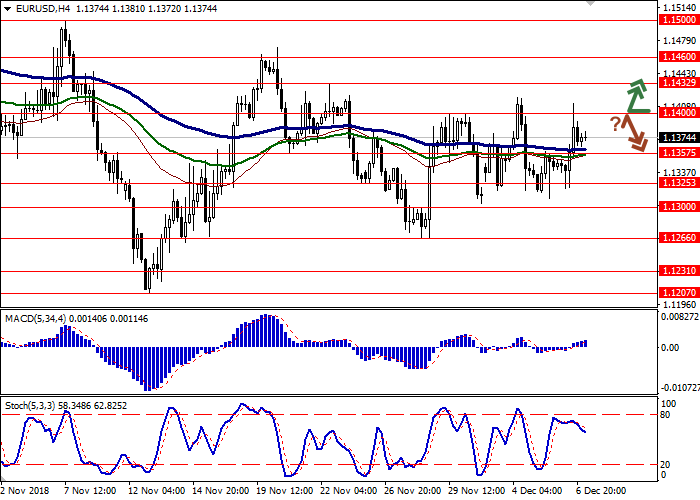

Trading tips
Long positions can be opened after the breakout of 1.1400 with the targets at 1.1460–1.1470. Stop loss is 1.1370.
Short positions can be opened after a rebound from 1.1400 and a breakdown of 1.1370 with the targets at 1.1325–1.1300. Stop loss is 1.1400.
Implementation period: 2–3 days.
Yesterday, EUR rose against USD, recovering slightly after the mixed trade dynamics on Tuesday and Wednesday.
Investors are focused on the situation around the arrest of Meng Wanzhou, the CFO of Huawei, accused of collaborating with Iran bypassing US sanctions. If she is sent to the United States, the 90-day truce may be broken, and further negotiations will be questionable. The case is complicated by the fact that Huawei is the leader in developing technologies that make the PRC less dependent on American and European suppliers, and the Chinese authorities will probably not leave the arrest of the company's leading manager without consequences.
On Friday, data on the Eurozone GDP in Q3 2018 will be published. Indicators are expected to remain the same. QoQ, GDP growth will be 0.2%, and YoY – 1.7%.
Support and resistance
On the daily chart, Bollinger bands are moving horizontally. The price range narrows from above, reflecting the flat nature of trading last week. The MACD indicator is growing, keeping a weak buy signal (the histogram is above the signal line). After a brief horizontal movement, Stochastic reverses upwards up again, responding to yesterday's strengthening of “bullish” moods.
It is better to keep current long positions in the short and/or super short term. It is better to wait for the appearance of additional trading signals before opening new positions.
Resistance levels: 1.1400, 1.1432, 1.1460, 1.1500.
Support levels: 1.1357, 1.1325, 1.1300, 1.1266.
Trading tips
Long positions can be opened after the breakout of 1.1400 with the targets at 1.1460–1.1470. Stop loss is 1.1370.
Short positions can be opened after a rebound from 1.1400 and a breakdown of 1.1370 with the targets at 1.1325–1.1300. Stop loss is 1.1400.
Implementation period: 2–3 days.


No comments:
Write comments