WTI Crude Oil: oil prices are going down
11 December 2018, 09:19
| Scenario | |
|---|---|
| Timeframe | Intraday |
| Recommendation | BUY STOP |
| Entry Point | 51.05 |
| Take Profit | 53.30, 54.43 |
| Stop Loss | 50.00 |
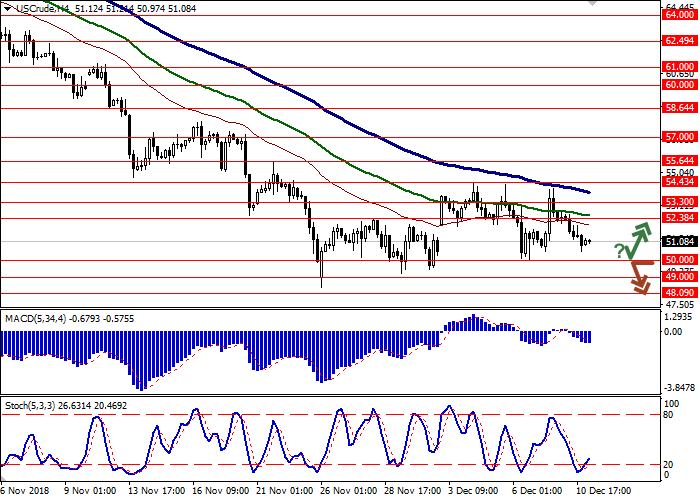
| Key Levels | 47.00, 48.09, 49.00, 50.00, 52.38, 53.30, 54.43, 55.64 |
| Alternative scenario | |
|---|---|
| Recommendation | SELL STOP |
| Entry Point | 49.95 |
| Take Profit | 48.09, 47.00 |
| Stop Loss | 51.00 |
| Key Levels | 47.00, 48.09, 49.00, 50.00, 52.38, 53.30, 54.43, 55.64 |
Current trend
WTI crude oil prices showed a decline on Monday, after an uncertain growth at the end of last week.
On Friday, the OPEC countries and their allies were able to agree on the volume of cuts in oil production under the OPEC+ treaty. The total reduction should amount to 1.2M barrels per day, of which the cartel’s share is 800K barrels per day, and the production of non-OPEC countries should be reduced by 400 barrels. At the same time, Iran was freed from the reduction due to the pressure of US sanctions. The conclusion of the agreement pushed the quotes up, but then the correction began, which continues today. Investors fear a decline in global demand for petroleum products due to trade conflicts.
Today, market participants are focused on API Weekly Crude Oil Stock. The previous report reflected a sharp increase in volumes of 5.36M barrels.
Support and resistance
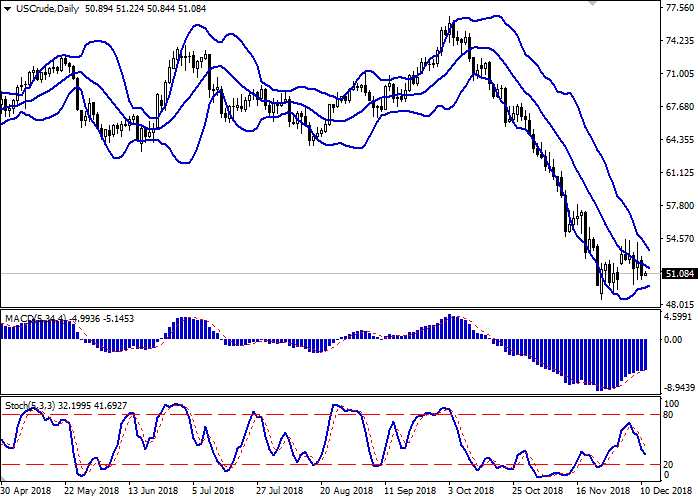
Bollinger Bands in D1 chart demonstrate a stable decrease. The price range is rapidly narrowing, reflecting the flat nature of trading in the short term. MACD is growing, keeping a weak buy signal (located above the signal line). Stochastic is steadily declining, approaching the "20" level, which can be called the formal boundary of the oversold instrument.
To open new positions, one should wait for additional trade signals to emerge.
Resistance levels: 52.38, 53.30, 54.43, 55.64.
Support levels: 50.00, 49.00, 48.09, 47.00.


Trading tips
To open long positions, one can rely on the rebound from the support level of 50.00 with the subsequent breakout of 51.00. Take profit — 53.30 or 54.43. Stop loss — 50.00.
A breakdown of 50.00 may be a signal to further sales with target at 48.09 or 47.00. Stop loss — 51.00.
Implementation period: 2-3 days.
WTI crude oil prices showed a decline on Monday, after an uncertain growth at the end of last week.
On Friday, the OPEC countries and their allies were able to agree on the volume of cuts in oil production under the OPEC+ treaty. The total reduction should amount to 1.2M barrels per day, of which the cartel’s share is 800K barrels per day, and the production of non-OPEC countries should be reduced by 400 barrels. At the same time, Iran was freed from the reduction due to the pressure of US sanctions. The conclusion of the agreement pushed the quotes up, but then the correction began, which continues today. Investors fear a decline in global demand for petroleum products due to trade conflicts.
Today, market participants are focused on API Weekly Crude Oil Stock. The previous report reflected a sharp increase in volumes of 5.36M barrels.
Support and resistance
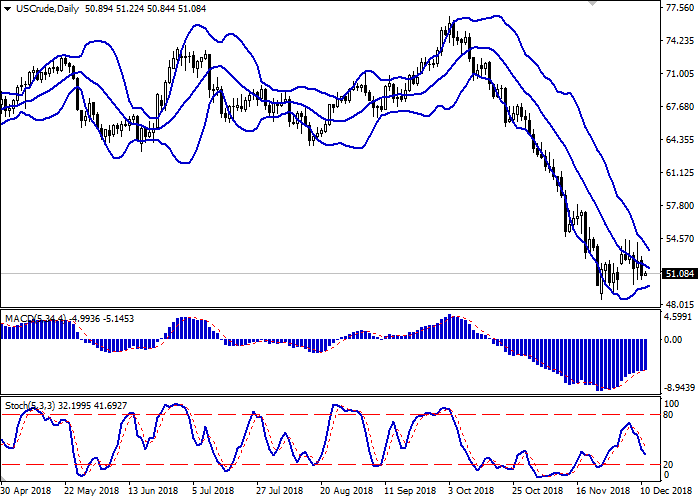
Bollinger Bands in D1 chart demonstrate a stable decrease. The price range is rapidly narrowing, reflecting the flat nature of trading in the short term. MACD is growing, keeping a weak buy signal (located above the signal line). Stochastic is steadily declining, approaching the "20" level, which can be called the formal boundary of the oversold instrument.
To open new positions, one should wait for additional trade signals to emerge.
Resistance levels: 52.38, 53.30, 54.43, 55.64.
Support levels: 50.00, 49.00, 48.09, 47.00.


Trading tips
To open long positions, one can rely on the rebound from the support level of 50.00 with the subsequent breakout of 51.00. Take profit — 53.30 or 54.43. Stop loss — 50.00.
A breakdown of 50.00 may be a signal to further sales with target at 48.09 or 47.00. Stop loss — 51.00.
Implementation period: 2-3 days.


No comments:
Write comments