XAG/USD: silver prices are consolidating
11 December 2018, 09:45
| Scenario | |
|---|---|
| Timeframe | Intraday |
| Recommendation | BUY STOP |
| Entry Point | 14.65 |
| Take Profit | 14.88, 15.00 |
| Stop Loss | 14.51 |
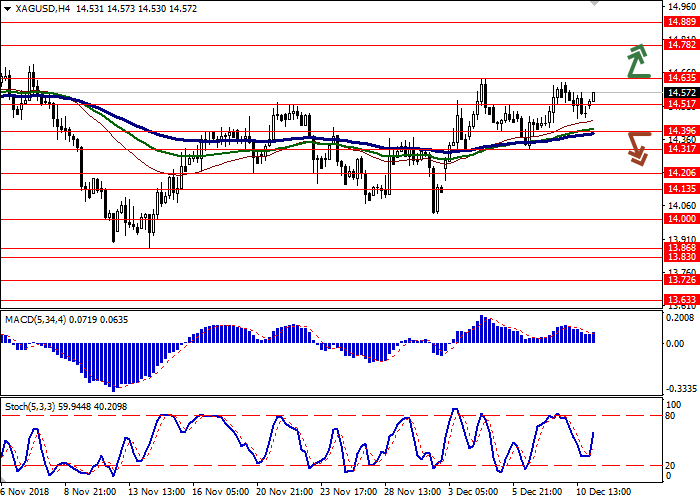
| Key Levels | 14.13, 14.20, 14.31, 14.39, 14.51, 14.63, 14.78, 14.88, 15.00 |
| Alternative scenario | |
|---|---|
| Recommendation | SELL STOP |
| Entry Point | 14.37 |
| Take Profit | 14.20, 14.13, 14.00 |
| Stop Loss | 14.51 |
| Key Levels | 14.13, 14.20, 14.31, 14.39, 14.51, 14.63, 14.78, 14.88, 15.00 |
Current trend
Silver prices showed a moderate decline on Monday, offsetting the growth of the instrument at the end of the previous trading week. Moderate support to the pair is provided by rumors of a possible pause in the increase of interest rate which may be left unchanged during the December meeting of the Fed.
Also investors are following trade relations between the US and China. Contrary to the concerns of the market, there was no hard reaction to the arrest of Huawei’s CFO Meng Wanzhou, although the US ambassador was summoned to the Chinese Foreign Ministry, and the official media of China criticized the actions of Canadian authorities. However, both sides continued trade talks. In addition, US Trade Representative Robert Lighthizer, citing President Donald Trump, said that the agreement with Beijing should be concluded before March 1; otherwise a new increase in US export duties is likely.
Support and resistance
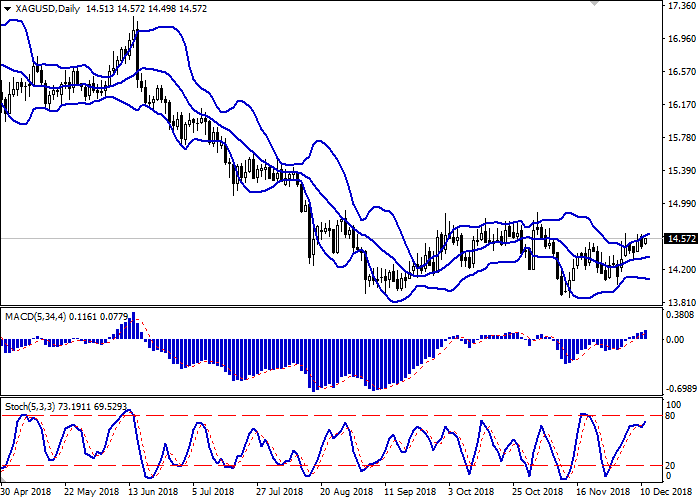
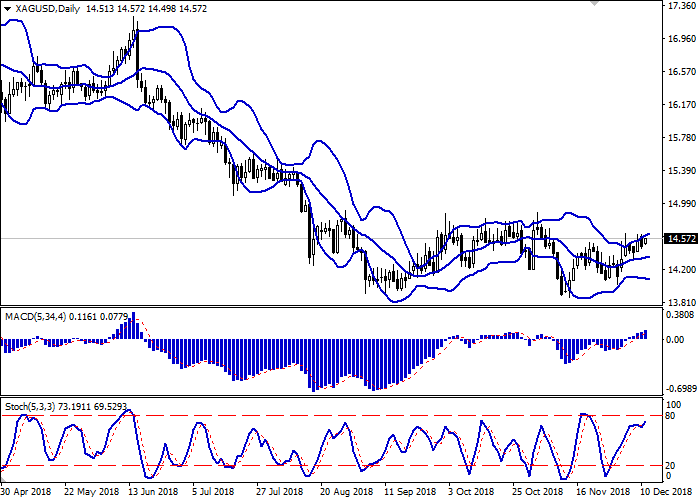
Bollinger Bands in D1 chart demonstrate flat dynamics. The price range expands from above, freeing a path to new local highs for the "bulls". MACD is growing, keeping a weak buy signal (located above the signal line). Stochastic demonstrates a similar dynamics but its line is already approaching its maximum levels, pointing at overbought silver in the ultra-short term.
Existing long positions should be kept until "bullish" signals are cancelled.
Resistance levels: 14.63, 14.78, 14.88, 15.00.
Support levels: 14.51, 14.39, 14.31, 14.20, 14.13.


Trading tips
To open long positions, one can rely on the breakout of 14.63. Take profit — 14.88 or 15.00. Stop loss — 14.51.
A confident breakdown of the level of 14.39 may be a signal to further sales with targets at 14.20, 14.13 or 14.00. Stop loss — 14.51.
Implementation period: 2-3 days.
Silver prices showed a moderate decline on Monday, offsetting the growth of the instrument at the end of the previous trading week. Moderate support to the pair is provided by rumors of a possible pause in the increase of interest rate which may be left unchanged during the December meeting of the Fed.
Also investors are following trade relations between the US and China. Contrary to the concerns of the market, there was no hard reaction to the arrest of Huawei’s CFO Meng Wanzhou, although the US ambassador was summoned to the Chinese Foreign Ministry, and the official media of China criticized the actions of Canadian authorities. However, both sides continued trade talks. In addition, US Trade Representative Robert Lighthizer, citing President Donald Trump, said that the agreement with Beijing should be concluded before March 1; otherwise a new increase in US export duties is likely.
Support and resistance
Bollinger Bands in D1 chart demonstrate flat dynamics. The price range expands from above, freeing a path to new local highs for the "bulls". MACD is growing, keeping a weak buy signal (located above the signal line). Stochastic demonstrates a similar dynamics but its line is already approaching its maximum levels, pointing at overbought silver in the ultra-short term.
Existing long positions should be kept until "bullish" signals are cancelled.
Resistance levels: 14.63, 14.78, 14.88, 15.00.
Support levels: 14.51, 14.39, 14.31, 14.20, 14.13.


Trading tips
To open long positions, one can rely on the breakout of 14.63. Take profit — 14.88 or 15.00. Stop loss — 14.51.
A confident breakdown of the level of 14.39 may be a signal to further sales with targets at 14.20, 14.13 or 14.00. Stop loss — 14.51.
Implementation period: 2-3 days.


No comments:
Write comments