
USD/JPY: Murrey analysis
03 December 2018, 13:11
| Scenario | |
|---|---|
| Timeframe | Weekly |
| Recommendation | SELL STOP |
| Entry Point | 113.20 |
| Take Profit | 112.50 |
| Stop Loss | 113.60 |
| Key Levels | 111.72, 112.50, 113.28, 114.06, 114.50, 114.84 |
| Alternative scenario | |
|---|---|
| Recommendation | BUY STOP |
| Entry Point | 114.10 |
| Take Profit | 114.50, 114.84 |
| Stop Loss | 113.70 |
| Key Levels | 111.72, 112.50, 113.28, 114.06, 114.50, 114.84 |
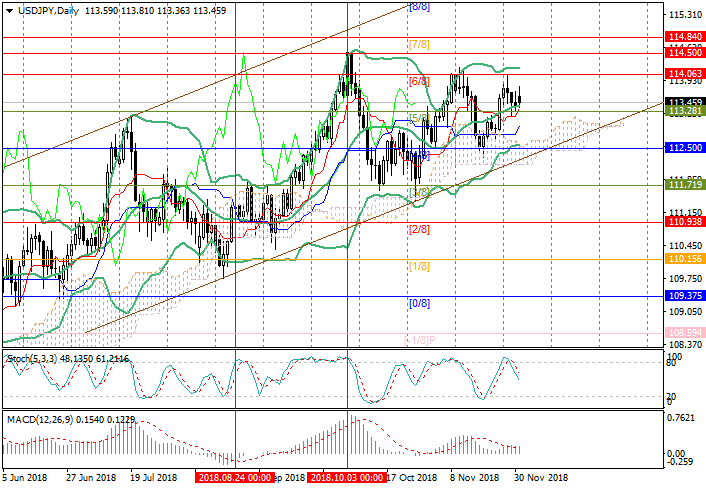
On D1 chart, the price dropped to around 113.28 ([5/8], the midline of
Bollinger Bands). After its breakdown, the decline can continue to 112.50 (the
central level of Murrey [4/8], the bottom line of Bollinger Bands, the lower
border of the ascending channel). The possibility of a decrease is confirmed by
a downward reverse of the Stochastic and MACD histogram declining in the
positive zone. The level of 114.06 ([6/8]) still seems a key one for the
"bulls". Its breakdown will give the prospect of growth to the levels of 114.50
(October highs) and 114.84 ([7/8]), but now it seems less likely.
Support and resistance
Support levels: 113.28, 112.50, 111.72.
Resistance levels: 114.06, 114.50, 114.84.
Trading tips
Short positions may be opened if the price consolidates below 113.28 with the target at 112.50 and stop loss at 113.60.
Long positions may be opened above the level of 114.06 with targets at 114.50, 114.84 and stop loss at 113.70.
Implementation period: 4-5 days.


No comments:
Write comments