
EUR/USD: the euro is strengthening
04 December 2018, 08:25
| Scenario | |
|---|---|
| Timeframe | Intraday |
| Recommendation | BUY STOP |
| Entry Point | 1.1405 |
| Take Profit | 1.1460, 1.1480, 1.1500 |
| Stop Loss | 1.1370 |
| Key Levels | 1.1266, 1.1300, 1.1325, 1.1357, 1.1400, 1.1432, 1.1460, 1.1500 |
| Alternative scenario | |
|---|---|
| Recommendation | SELL STOP |
| Entry Point | 1.1365 |
| Take Profit | 1.1300 |
| Stop Loss | 1.1400 |
| Key Levels | 1.1266, 1.1300, 1.1325, 1.1357, 1.1400, 1.1432, 1.1460, 1.1500 |
Current trend
EUR showed a slight increase against USD on Monday, recovering slightly after a steady decline at the end of the previous trading week.
Yesterday morning, EUR strengthened due to the trade truce between the US and China. However, after EU Manufacturing PMI release, the currency began to weaken. In November, the indicator fell for the fourth consecutive month and amounted to 51.8 points against 52.0 points in October. This is the worst result since August 2016. However, it is possible that the negotiations between Donald Trump and Xi Jinping will still have a positive effect on the optimism of the leadership of European companies next month.
Support and resistance
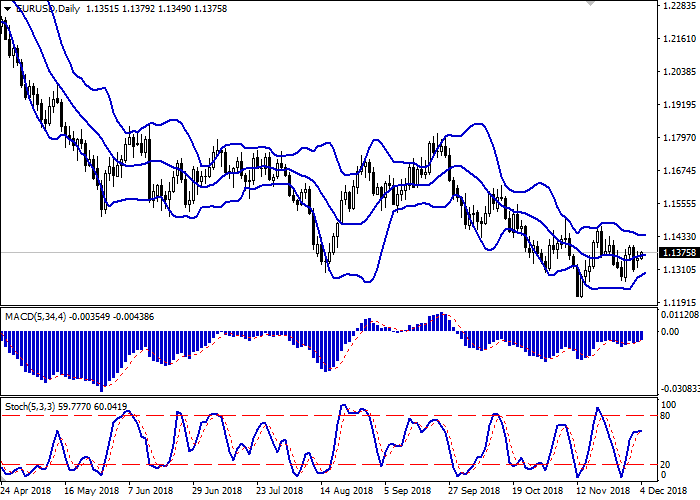
Bollinger Bands in D1 chart demonstrate flat dynamics. The price range is narrowing from below, reflecting the emergence of ambiguous dynamics of trading in the short term. MACD indicator is growing keeping quite stable buy signal (located above the signal line). Stochastic slowed down after active growth last week and is currently prone to reversing into a horizontal plane.
Existing long positions should be kept until the situation clears up.
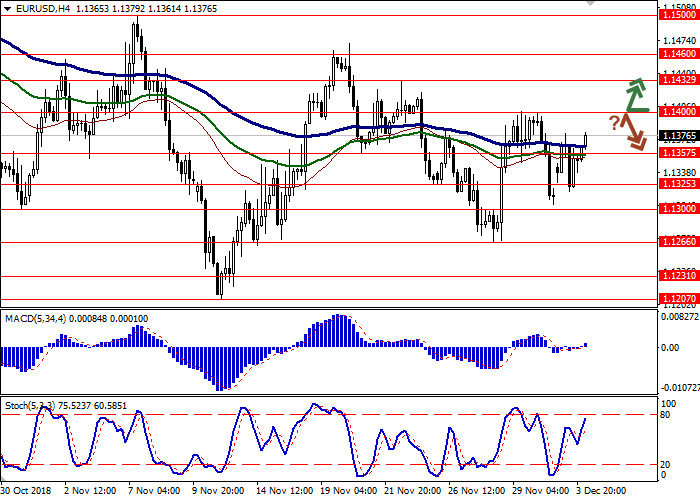
Resistance levels: 1.1400, 1.1432, 1.1460, 1.1500.
Support levels: 1.1357, 1.1325, 1.1300, 1.1266.
Trading tips
To open long positions, one can rely on the breakout of 1.1400. Take profit — 1.1460 or 1.1480, 1.1500. Stop loss — 1.1370.
A rebound from 1.1400 as from resistance, followed by a breakdown of 1.1370 may become a signal for new sales with the target at 1.1300. Stop loss — 1.1400.
Implementation period: 2-3 days.
EUR showed a slight increase against USD on Monday, recovering slightly after a steady decline at the end of the previous trading week.
Yesterday morning, EUR strengthened due to the trade truce between the US and China. However, after EU Manufacturing PMI release, the currency began to weaken. In November, the indicator fell for the fourth consecutive month and amounted to 51.8 points against 52.0 points in October. This is the worst result since August 2016. However, it is possible that the negotiations between Donald Trump and Xi Jinping will still have a positive effect on the optimism of the leadership of European companies next month.
Support and resistance
Bollinger Bands in D1 chart demonstrate flat dynamics. The price range is narrowing from below, reflecting the emergence of ambiguous dynamics of trading in the short term. MACD indicator is growing keeping quite stable buy signal (located above the signal line). Stochastic slowed down after active growth last week and is currently prone to reversing into a horizontal plane.
Existing long positions should be kept until the situation clears up.
Resistance levels: 1.1400, 1.1432, 1.1460, 1.1500.
Support levels: 1.1357, 1.1325, 1.1300, 1.1266.
Trading tips
To open long positions, one can rely on the breakout of 1.1400. Take profit — 1.1460 or 1.1480, 1.1500. Stop loss — 1.1370.
A rebound from 1.1400 as from resistance, followed by a breakdown of 1.1370 may become a signal for new sales with the target at 1.1300. Stop loss — 1.1400.
Implementation period: 2-3 days.


No comments:
Write comments