
USD/JPY: the instrument is consolidating
13 December 2018, 08:39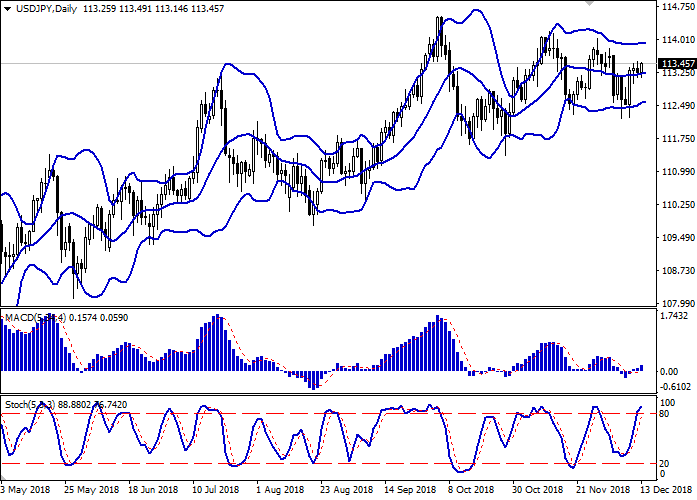
| Scenario | |
|---|---|
| Timeframe | Intraday |
| Recommendation | BUY STOP |
| Entry Point | 113.70 |
| Take Profit | 114.07 |
| Stop Loss | 113.50 |
| Key Levels | 112.65, 113.00, 113.18, 113.37, 113.64, 113.83, 114.07 |
| Alternative scenario | |
|---|---|
| Recommendation | SELL STOP |
| Entry Point | 113.35 |
| Take Profit | 113.00 |
| Stop Loss | 113.64 |
| Key Levels | 112.65, 113.00, 113.18, 113.37, 113.64, 113.83, 114.07 |
Current trend
USD showed ambiguous dynamics against JPY on Wednesday, having updated local highs of December 4.
Data on machinery orders in Japan were weaker than market expectations. In October, MoM the figure rose by 7.6% instead of the expected 10.2%, and YoY it rose by 4.5% instead of the expected 5.9%. On the other hand, the December Tertiary Industry Activity Index of Japan increased by 1.9%, which is the most significant growth since 2014. In general, Japanese investors continue to follow the trade negotiations between China and the United States, counting on their positive outcome.
A block of statistics from Japan is expected to be published this Friday, including Tankan data on business activity for Q4 2018 and the October statistics on industrial production and capacity utilization.
Support and resistance
Bollinger Bands in D1 chart demonstrate flat dynamics. The price range is trying to consolidate, while remaining spacious enough for the current activity level in the market. MACD indicator is growing keeping a moderate buy signal (located above the signal line). Stochastic maintains an uptrend, but is located in close proximity to its maximum levels, which indicates risks of overbought USD in the ultra-short term.
"Bullish" positions can be kept until the situation at the market clears up.
Resistance levels: 113.64, 113.83, 114.07.
Support levels: 113.37, 113.18, 113.00, 112.65.


Trading tips
To open long positions, one can rely on the breakout of 113.64. Take-profit — 114.07. Stop loss — 113.50. Implementation period: 1-2 days.
A rebound from 113.64 as from resistance, followed by a breakdown of 113.50 or 113.37 may become a signal to start sales with the target at 113.00. Stop loss — 113.50 or 113.64. Implementation period: 2-3 days.
USD showed ambiguous dynamics against JPY on Wednesday, having updated local highs of December 4.
Data on machinery orders in Japan were weaker than market expectations. In October, MoM the figure rose by 7.6% instead of the expected 10.2%, and YoY it rose by 4.5% instead of the expected 5.9%. On the other hand, the December Tertiary Industry Activity Index of Japan increased by 1.9%, which is the most significant growth since 2014. In general, Japanese investors continue to follow the trade negotiations between China and the United States, counting on their positive outcome.
A block of statistics from Japan is expected to be published this Friday, including Tankan data on business activity for Q4 2018 and the October statistics on industrial production and capacity utilization.
Support and resistance
Bollinger Bands in D1 chart demonstrate flat dynamics. The price range is trying to consolidate, while remaining spacious enough for the current activity level in the market. MACD indicator is growing keeping a moderate buy signal (located above the signal line). Stochastic maintains an uptrend, but is located in close proximity to its maximum levels, which indicates risks of overbought USD in the ultra-short term.
"Bullish" positions can be kept until the situation at the market clears up.
Resistance levels: 113.64, 113.83, 114.07.
Support levels: 113.37, 113.18, 113.00, 112.65.
Trading tips
To open long positions, one can rely on the breakout of 113.64. Take-profit — 114.07. Stop loss — 113.50. Implementation period: 1-2 days.
A rebound from 113.64 as from resistance, followed by a breakdown of 113.50 or 113.37 may become a signal to start sales with the target at 113.00. Stop loss — 113.50 or 113.64. Implementation period: 2-3 days.


No comments:
Write comments