
USD/CAD: the US dollar is declining
13 December 2018, 08:18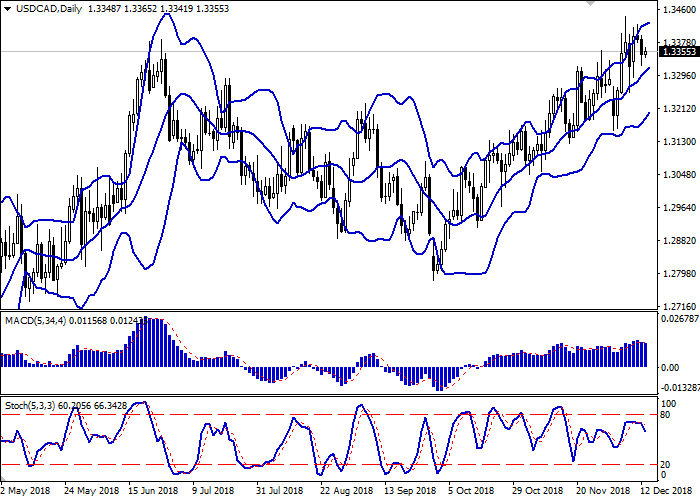
| Scenario | |
|---|---|
| Timeframe | Intraday |
| Recommendation | BUY STOP |
| Entry Point | 1.3380, 1.3410 |
| Take Profit | 1.3479, 1.3500 |
| Stop Loss | 1.3350, 1.3330 |
| Key Levels | 1.3158, 1.3200, 1.3241, 1.3264, 1.3321, 1.3373, 1.3401, 1.3443, 1.3479 |
| Alternative scenario | |
|---|---|
| Recommendation | SELL STOP |
| Entry Point | 1.3315 |
| Take Profit | 1.3241, 1.3200 |
| Stop Loss | 1.3355 |
| Key Levels | 1.3158, 1.3200, 1.3241, 1.3264, 1.3321, 1.3373, 1.3401, 1.3443, 1.3479 |
Current trend
USD showed a decline against CAD on Wednesday, continuing the development of the "bearish" momentum formed the day before.
Investors are focused on US-China trade talks. President Donald Trump said that he did not intend to raise tariffs on Chinese imports until the end of the talks. The president also noted that he could have intervened with the arrest of Huawei CFO Meng Wanzhou, if it had helped to conclude a deal with the PRC. Yesterday, the Chinese authorities detained the former Canadian diplomat Michael Kovrig. Many experts believe that this is an element of pressure on Canada in order to avoid the extradition of Meng Wanzhou to the US. One way or another, Meng Wanzhou was released on bail.
Support and resistance
Bollinger Bands on D1 chart show stable growth. The price range is narrowing, reflecting the emergence of ambiguous dynamics of trading in the short term. MACD is declining keeping a weak sell signal (located below the signal line). After a long flat period, Stochastic is also reversing into a descending plane.
It is worth looking into the possibility of the downtrend in the short and/or ultra-short term.
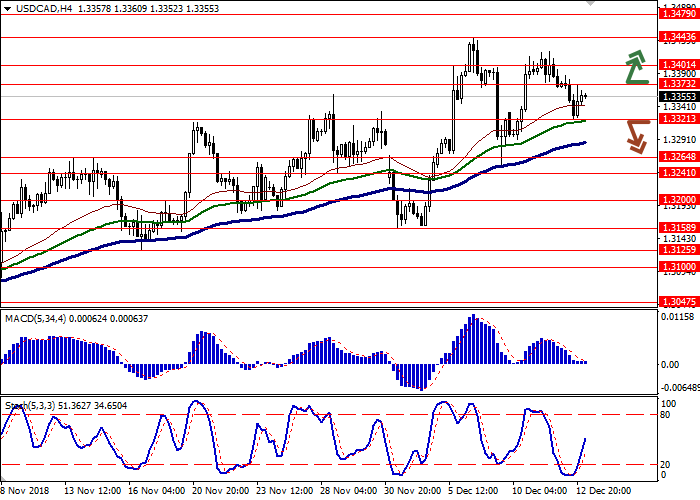
Resistance levels: 1.3373, 1.3401, 1.3443, 1.3479.
Support levels: 1.3321, 1.3264, 1.3241, 1.3200, 1.3158.

Trading tips
To open long positions, one can rely on the breakout of 1.3373 or 1.3401. Take profit — 1.3479 or 1.3500. Stop loss — 1.3350 or 1.3330.
A breakdown of 1.3321 may be a signal to resume sales with target at 1.3241 or 1.3200. Stop loss — 1.3355.
Implementation period: 2-3 days.
USD showed a decline against CAD on Wednesday, continuing the development of the "bearish" momentum formed the day before.
Investors are focused on US-China trade talks. President Donald Trump said that he did not intend to raise tariffs on Chinese imports until the end of the talks. The president also noted that he could have intervened with the arrest of Huawei CFO Meng Wanzhou, if it had helped to conclude a deal with the PRC. Yesterday, the Chinese authorities detained the former Canadian diplomat Michael Kovrig. Many experts believe that this is an element of pressure on Canada in order to avoid the extradition of Meng Wanzhou to the US. One way or another, Meng Wanzhou was released on bail.
Support and resistance
Bollinger Bands on D1 chart show stable growth. The price range is narrowing, reflecting the emergence of ambiguous dynamics of trading in the short term. MACD is declining keeping a weak sell signal (located below the signal line). After a long flat period, Stochastic is also reversing into a descending plane.
It is worth looking into the possibility of the downtrend in the short and/or ultra-short term.
Resistance levels: 1.3373, 1.3401, 1.3443, 1.3479.
Support levels: 1.3321, 1.3264, 1.3241, 1.3200, 1.3158.
Trading tips
To open long positions, one can rely on the breakout of 1.3373 or 1.3401. Take profit — 1.3479 or 1.3500. Stop loss — 1.3350 or 1.3330.
A breakdown of 1.3321 may be a signal to resume sales with target at 1.3241 or 1.3200. Stop loss — 1.3355.
Implementation period: 2-3 days.


No comments:
Write comments