
USD/JPY: general analysis
18 December 2018, 11:39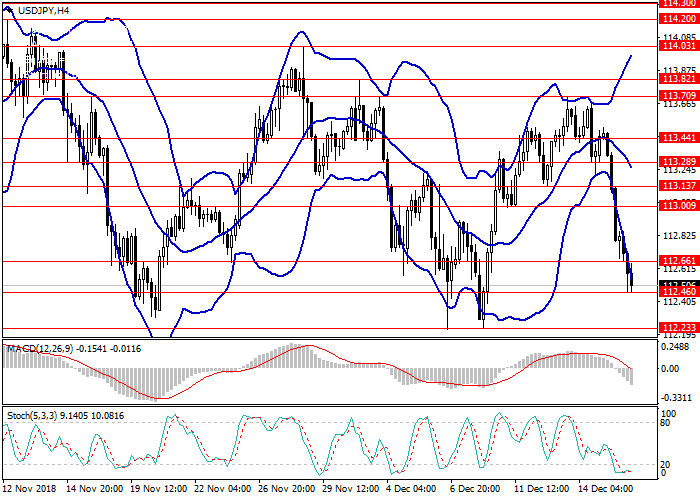
| Scenario | |
|---|---|
| Timeframe | Intraday |
| Recommendation | SELL |
| Entry Point | 112.31 |
| Take Profit | 112.00 |
| Stop Loss | 112.50 |
| Key Levels | 111.37, 111.62, 112.00, 112.23, 112.46, 112.66, 113.00, 113.13, 113.28, 113.44, 113.70 |
| Alternative scenario | |
|---|---|
| Recommendation | BUY STOP |
| Entry Point | 113.00 |
| Take Profit | 113.70 |
| Stop Loss | 112.70 |
| Key Levels | 111.37, 111.62, 112.00, 112.23, 112.46, 112.66, 113.00, 113.13, 113.28, 113.44, 113.70 |
Current trend
The USD/JPY pair is falling for the third day in a row prior the US Federal Reserve meeting on Wednesday, on which the regulator is expected to announce monetary tightening, raising the rate by 25 basis points from 2.25% to 2.50%. The increase in interest rates in the current situation will negatively affect the USD rate due to increased pressure on the stock market, the national currency and the economy as a whole. At the same time, much will depend on the comments of Fed Chairman J. Powell, who previously stated that the rates are now just below the neutral level, implying that the potential for further increases is limited. Some investors believe that the rhetoric of the regulator will be less aggressive, and in conjunction with good macroeconomic indicators, the meeting may support the dollar.
Today, investors will pay attention to the publication of statistics on the number of building permits issued in the United States. The value of this indicator is expected to drop to 1.259 million in November from 1.265 million a month earlier. Confirmation the forecast could put pressure on the dollar in the short term.
Support and resistance
On the 4-hour chart, the pair is decreasing along the lower border of the Bollinger Band indicator, the price range is expanded, which indicates a possible continuation of the downtrend. The MACD histogram is in the negative region, gradually increasing the volume, the signal line is preparing to cross the body of the histogram from top to bottom, after which a signal to open short positions will be formed.
Support levels: 112.46, 112.23, 112.00, 111.62, 111.37.
Resistance levels: 112.66, 113.00, 113.13, 113.28, 113.44, 113.70.

Trading tips
Short positions can be opened at the current price with target at 112.00 and a stop loss at 112.50.
Buy orders should be placed at 113.00 with a target of 113.70 and a stop loss at 112.70.
Implementation period: 1-3 days.
The USD/JPY pair is falling for the third day in a row prior the US Federal Reserve meeting on Wednesday, on which the regulator is expected to announce monetary tightening, raising the rate by 25 basis points from 2.25% to 2.50%. The increase in interest rates in the current situation will negatively affect the USD rate due to increased pressure on the stock market, the national currency and the economy as a whole. At the same time, much will depend on the comments of Fed Chairman J. Powell, who previously stated that the rates are now just below the neutral level, implying that the potential for further increases is limited. Some investors believe that the rhetoric of the regulator will be less aggressive, and in conjunction with good macroeconomic indicators, the meeting may support the dollar.
Today, investors will pay attention to the publication of statistics on the number of building permits issued in the United States. The value of this indicator is expected to drop to 1.259 million in November from 1.265 million a month earlier. Confirmation the forecast could put pressure on the dollar in the short term.
Support and resistance
On the 4-hour chart, the pair is decreasing along the lower border of the Bollinger Band indicator, the price range is expanded, which indicates a possible continuation of the downtrend. The MACD histogram is in the negative region, gradually increasing the volume, the signal line is preparing to cross the body of the histogram from top to bottom, after which a signal to open short positions will be formed.
Support levels: 112.46, 112.23, 112.00, 111.62, 111.37.
Resistance levels: 112.66, 113.00, 113.13, 113.28, 113.44, 113.70.
Trading tips
Short positions can be opened at the current price with target at 112.00 and a stop loss at 112.50.
Buy orders should be placed at 113.00 with a target of 113.70 and a stop loss at 112.70.
Implementation period: 1-3 days.


No comments:
Write comments