
USD/CHF: technical analysis
04 December 2018, 09:05
| Scenario | |
|---|---|
| Timeframe | Intraday |
| Recommendation | BUY STOP |
| Entry Point | 0.9980 |
| Take Profit | 1.0020 |
| Stop Loss | 0.9960 |
| Key Levels | 0.9760, 0.9799, 0.9848, 0.9877, 0.9906, 0.9930, 1.0000, 1.0041, 1.0069, 1.0087, 1.0121 |
| Alternative scenario | |
|---|---|
| Recommendation | SELL STOP |
| Entry Point | 0.9945 |
| Take Profit | 0.9905 |
| Stop Loss | 0.9965 |
| Key Levels | 0.9760, 0.9799, 0.9848, 0.9877, 0.9906, 0.9930, 1.0000, 1.0041, 1.0069, 1.0087, 1.0121 |
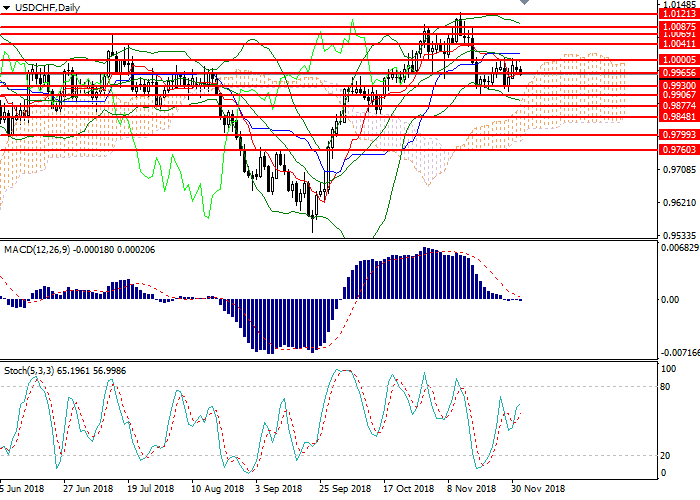
USD/CHF, D1
On the daily chart, the instrument is trying to consolidate above the moving average of Bollinger Bands. Significant resistance level is 1.0000. The indicator is reversing downwards, and the price range has widened slightly, which is the reason for the decline in the pair. MACD histogram is being corrected in the neutral zone, the signal to enter the market is not formed. Stochastic does not give a clear signal to enter the market.
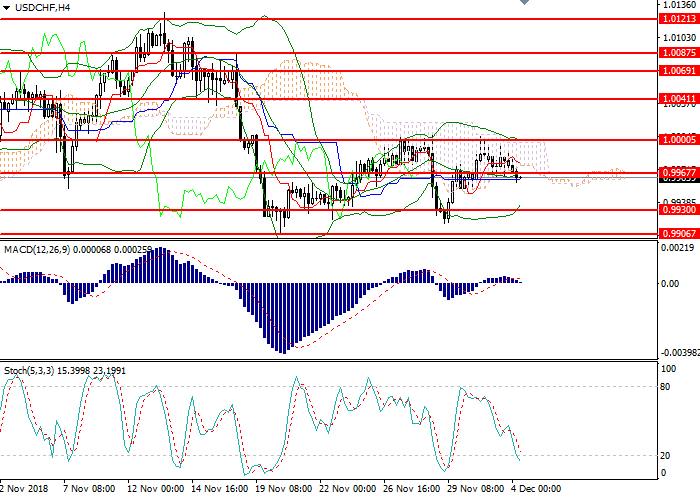
USD/CHF, H4
On the 4-hour chart, the instrument consolidated below the middle line of Bollinger bands. The key resistance level is 0.9967. The indicator is directed horizontally, and the price range has narrowed, indicating a change in the current trend within the intraday correction. MACD histogram is at the zero line and does not give a signal to open positions. Stochastic entered the oversold area, a signal to open buy positions can be formed during the day.
Key levels
Resistance levels: 1.0000, 1.0041, 1.0069, 1.0087, 1.0121.
Support levels: 0.9930, 0.9906, 0.9877, 0.9848, 0.9799, 0.9760.
Trading tips
Long positions can be opened above the level of 0.9975 with the target at 1.0020 and stop loss 0.9960. Implementation period: 1 day.
Short positions can be opened below the level of 0.9950 with the target at 0.9905 and stop loss 0.9965. Implementation period: 1–2 days.
On the daily chart, the instrument is trying to consolidate above the moving average of Bollinger Bands. Significant resistance level is 1.0000. The indicator is reversing downwards, and the price range has widened slightly, which is the reason for the decline in the pair. MACD histogram is being corrected in the neutral zone, the signal to enter the market is not formed. Stochastic does not give a clear signal to enter the market.
USD/CHF, H4
On the 4-hour chart, the instrument consolidated below the middle line of Bollinger bands. The key resistance level is 0.9967. The indicator is directed horizontally, and the price range has narrowed, indicating a change in the current trend within the intraday correction. MACD histogram is at the zero line and does not give a signal to open positions. Stochastic entered the oversold area, a signal to open buy positions can be formed during the day.
Key levels
Resistance levels: 1.0000, 1.0041, 1.0069, 1.0087, 1.0121.
Support levels: 0.9930, 0.9906, 0.9877, 0.9848, 0.9799, 0.9760.
Trading tips
Long positions can be opened above the level of 0.9975 with the target at 1.0020 and stop loss 0.9960. Implementation period: 1 day.
Short positions can be opened below the level of 0.9950 with the target at 0.9905 and stop loss 0.9965. Implementation period: 1–2 days.


No comments:
Write comments