
XAU/USD: gold prices are rising
04 December 2018, 08:58
| Scenario | |
|---|---|
| Timeframe | Intraday |
| Recommendation | BUY |
| Entry Point | 1237.55 |
| Take Profit | 1243.21, 1250.00 |
| Stop Loss | 1233.08 |
| Key Levels | 1220.12, 1226.11, 1229.84, 1233.08, 1237.16, 1240.00, 1243.21 |
| Alternative scenario | |
|---|---|
| Recommendation | SELL STOP |
| Entry Point | 1233.00 |
| Take Profit | 1226.11, 1220.12 |
| Stop Loss | 1237.16 |
| Key Levels | 1220.12, 1226.11, 1229.84, 1233.08, 1237.16, 1240.00, 1243.21 |
Current trend
Yesterday, gold prices rose significantly and updated local highs since November 7 due to some weakening of USD after the rather optimistic results of the G20 summit.
USD is under pressure of ambiguous US macroeconomic statistics. November ISM Manufacturing Prices index dropped sharply from 71.6 to 60.7 points, while analysts expected a decline only to 69.1 points. The Markit Manufacturing PMI fell from 55.4 to 55.3 points in November, which did not meet the analysts' expectations. However, ISM Manufacturing PMI in November rose from 57.7 to 59.3 points, which exceeded the forecast of 57.5 points.
Support and resistance
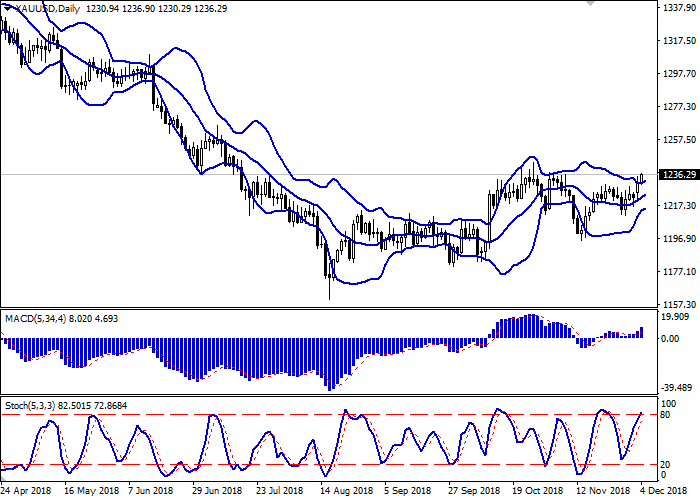
On the daily chart, Bollinger bands are growing moderately. The price range is practically not widening, which significantly limits the development potential of the current “bullish” momentum in the short term. MACD indicator is growing, keeping a relatively strong buy signal (the histogram is above the signal line). Stochastic is directed upwards but is rapidly approaching its highs, which indicates the risks associated with overbought gold in the super short term.
Nevertheless, the current readings of the indicators do not contradict the further development of the “bullish” dynamics.
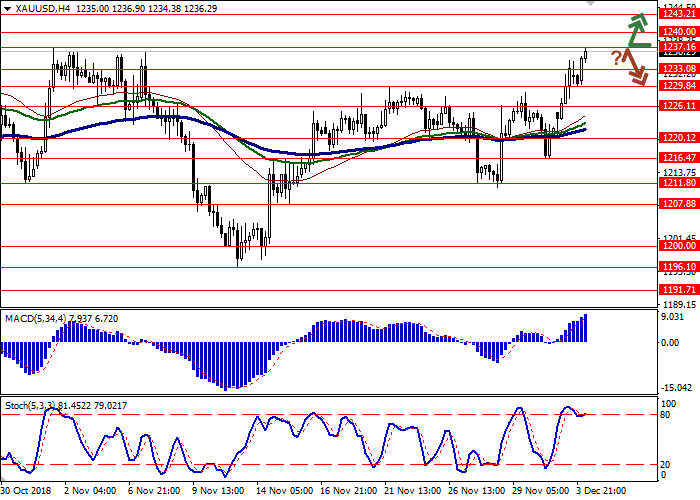
Resistance levels: 1237.16, 1240.00, 1243.21.
Support levels: 1233.08, 1229.84, 1226.11, 1220.12.
Trading tips
Long positions can be opened after the breakout of the level of 1237.16 with the target at 1243.21 or 1250.00. Stop loss is 1233.08. Implementation period: 1–2 days.
Short positions can be opened after the rebound from the level of 1237.16 and the breakdown of the level of 1233.08 with the target at 1226.11 or 1220.12. Stop loss is 1237.16. Implementation period: 2–3 days.
Yesterday, gold prices rose significantly and updated local highs since November 7 due to some weakening of USD after the rather optimistic results of the G20 summit.
USD is under pressure of ambiguous US macroeconomic statistics. November ISM Manufacturing Prices index dropped sharply from 71.6 to 60.7 points, while analysts expected a decline only to 69.1 points. The Markit Manufacturing PMI fell from 55.4 to 55.3 points in November, which did not meet the analysts' expectations. However, ISM Manufacturing PMI in November rose from 57.7 to 59.3 points, which exceeded the forecast of 57.5 points.
Support and resistance
On the daily chart, Bollinger bands are growing moderately. The price range is practically not widening, which significantly limits the development potential of the current “bullish” momentum in the short term. MACD indicator is growing, keeping a relatively strong buy signal (the histogram is above the signal line). Stochastic is directed upwards but is rapidly approaching its highs, which indicates the risks associated with overbought gold in the super short term.
Nevertheless, the current readings of the indicators do not contradict the further development of the “bullish” dynamics.
Resistance levels: 1237.16, 1240.00, 1243.21.
Support levels: 1233.08, 1229.84, 1226.11, 1220.12.
Trading tips
Long positions can be opened after the breakout of the level of 1237.16 with the target at 1243.21 or 1250.00. Stop loss is 1233.08. Implementation period: 1–2 days.
Short positions can be opened after the rebound from the level of 1237.16 and the breakdown of the level of 1233.08 with the target at 1226.11 or 1220.12. Stop loss is 1237.16. Implementation period: 2–3 days.


No comments:
Write comments