USD/CHF: the pair is trading in both directions
06 December 2018, 09:15
| Scenario | |
|---|---|
| Timeframe | Intraday |
| Recommendation | BUY STOP |
| Entry Point | 0.9985 |
| Take Profit | 1.0027, 1.0050 |
| Stop Loss | 0.9960 |
| Key Levels | 0.9889, 0.9907, 0.9926, 0.9951, 0.9980, 1.0000, 1.0027, 1.0050 |
| Alternative scenario | |
|---|---|
| Recommendation | SELL STOP |
| Entry Point | 0.9945 |
| Take Profit | 0.9907, 0.9889 |
| Stop Loss | 0.9970, 0.9980 |
| Key Levels | 0.9889, 0.9907, 0.9926, 0.9951, 0.9980, 1.0000, 1.0027, 1.0050 |
Current trend
USD shows ambiguous trading against CHF, staying close to the psychological level of 1.0000.
The positions of USD remain quite weak, as investors expect new drivers to appear at the end of the week, when the November report on the labor market and the statistics block on business activity and the dynamics of jobless claims will be published. Not much data is expected from Switzerland, so investors will also focus on the European statistics.
CHF is supported by Retail Sales data and a positive Services PMI in the eurozone. In November, the German index remained at the same level of 53.3 points, while EU one grew from 53.1 to 53.4 points. EU October Retail Sales rose by 0.3% after a significant decline in September by 0.5%. Investors continue monitoring the development of the situation around Italian budget.
Support and resistance
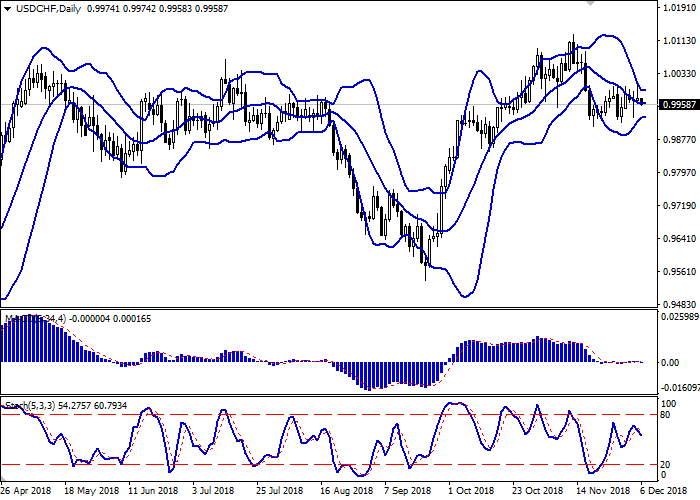
Bollinger Bands in D1 chart demonstrate flat dynamics. The price range consolidated in narrow borders, which correspond to the current activity of trading. MACD extends along the zero level, keeping the sell signal (located below the signal line). Stochastic also shows ambiguous dynamics and does not contradict the further development of flat trades.
One should wait for the clarification and formation of stronger trade signals.
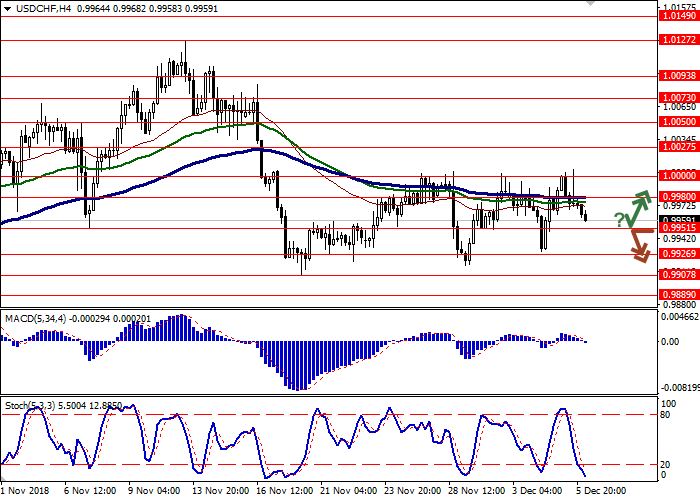
Resistance levels: 0.9980, 1.0000, 1.0027, 1.0050.
Support levels: 0.9951, 0.9926, 0.9907, 0.9889.


Trading tips
Long positions can be opened if the price rebounds from 0.9951 followed by the breakout of 0.9980. Take profit — 1.0027 or 1.0050. Stop loss — 0.9960.
A confident breakdown of 0.9951 may become a signal to further sales with target at 0.9907 or 0.9889. Stop loss — 0.9970 or 0.9980.
Implementation period: 2-3 days.
USD shows ambiguous trading against CHF, staying close to the psychological level of 1.0000.
The positions of USD remain quite weak, as investors expect new drivers to appear at the end of the week, when the November report on the labor market and the statistics block on business activity and the dynamics of jobless claims will be published. Not much data is expected from Switzerland, so investors will also focus on the European statistics.
CHF is supported by Retail Sales data and a positive Services PMI in the eurozone. In November, the German index remained at the same level of 53.3 points, while EU one grew from 53.1 to 53.4 points. EU October Retail Sales rose by 0.3% after a significant decline in September by 0.5%. Investors continue monitoring the development of the situation around Italian budget.
Support and resistance
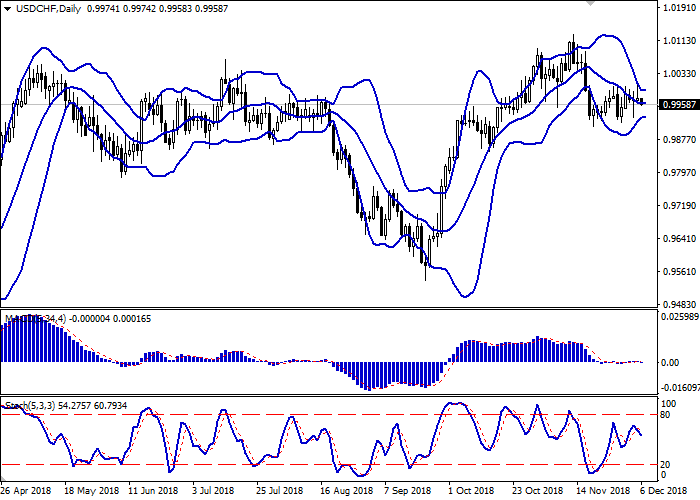
Bollinger Bands in D1 chart demonstrate flat dynamics. The price range consolidated in narrow borders, which correspond to the current activity of trading. MACD extends along the zero level, keeping the sell signal (located below the signal line). Stochastic also shows ambiguous dynamics and does not contradict the further development of flat trades.
One should wait for the clarification and formation of stronger trade signals.
Resistance levels: 0.9980, 1.0000, 1.0027, 1.0050.
Support levels: 0.9951, 0.9926, 0.9907, 0.9889.


Trading tips
Long positions can be opened if the price rebounds from 0.9951 followed by the breakout of 0.9980. Take profit — 1.0027 or 1.0050. Stop loss — 0.9960.
A confident breakdown of 0.9951 may become a signal to further sales with target at 0.9907 or 0.9889. Stop loss — 0.9970 or 0.9980.
Implementation period: 2-3 days.


No comments:
Write comments