NZD/USD: the instrument is in correction
06 December 2018, 08:56
| Scenario | |
|---|---|
| Timeframe | Intraday |
| Recommendation | BUY |
| Entry Point | 0.6870 |
| Take Profit | 0.6968, 0.7000 |
| Stop Loss | 0.6843, 0.6830 |
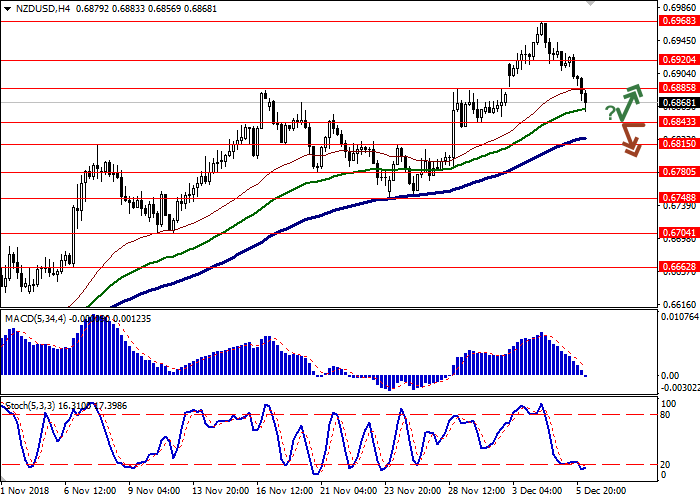
| Key Levels | 0.6748, 0.6780, 0.6815, 0.6843, 0.6885, 0.6920, 0.6968, 0.7000 |
| Alternative scenario | |
|---|---|
| Recommendation | SELL STOP |
| Entry Point | 0.6835 |
| Take Profit | 0.6780, 0.6748 |
| Stop Loss | 0.6875 |
| Key Levels | 0.6748, 0.6780, 0.6815, 0.6843, 0.6885, 0.6920, 0.6968, 0.7000 |
Current trend
Yesterday, NZD fell against USD, being corrected after the renewal of highs since June 15 the day before.
Investors monitor US-China trade relations and are awaiting the implementation of the concluded agreements. On Wednesday, the Chinese Ministry of Commerce announced that it started to implement the agreements, and US began to prepare for the resumption of soybeans and liquefied gas imports to the PRC. China promised to increase purchases of American products, mainly agricultural; in return, the US would postpone the introduction of new tariffs for 90 days. However, the main negotiations on the protection of American intellectual property in China are still ahead. The day before, President Trump reiterated his intention to continue raising tariffs if the deal with China could not be concluded within three months.
Support and resistance
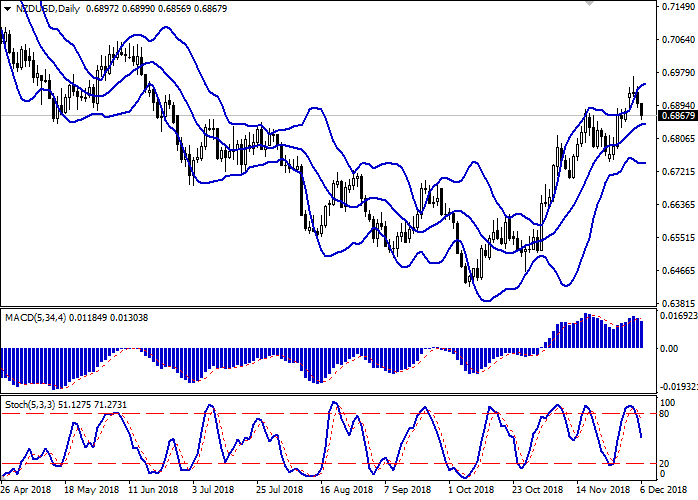
On the daily chart, Bollinger bands reverse horizontally. The price range expands from above, reacting poorly to the appearance of an active “bearish” dynamics. MACD indicator is falling, keeping a moderate sell signal (the histogram is below the signal line). Stochastic goes down, being in the center of its working area, which indicates the possibility of the development of a downward trend in the super short term.
The current readings of technical indicators do not contradict the further development of the “bearish” trend in the near future.
Resistance levels: 0.6885, 0.6920, 0.6968, 0.7000.
Support levels: 0.6843, 0.6815, 0.6780, 0.6748.


Trading tips
Long positions can be opened after a rebound from the level of 0.6843 and a breakout of 0.6860–0.6885 with the target at 0.6968 or 0.7000. Stop loss is 0.6843–0.6830.
Short positions can be opened after the breakdown of 0.6843 with the target at 0.6780 or 0.6748. Stop loss is 0.6875.
Implementation period: 2–3 days.
Yesterday, NZD fell against USD, being corrected after the renewal of highs since June 15 the day before.
Investors monitor US-China trade relations and are awaiting the implementation of the concluded agreements. On Wednesday, the Chinese Ministry of Commerce announced that it started to implement the agreements, and US began to prepare for the resumption of soybeans and liquefied gas imports to the PRC. China promised to increase purchases of American products, mainly agricultural; in return, the US would postpone the introduction of new tariffs for 90 days. However, the main negotiations on the protection of American intellectual property in China are still ahead. The day before, President Trump reiterated his intention to continue raising tariffs if the deal with China could not be concluded within three months.
Support and resistance
On the daily chart, Bollinger bands reverse horizontally. The price range expands from above, reacting poorly to the appearance of an active “bearish” dynamics. MACD indicator is falling, keeping a moderate sell signal (the histogram is below the signal line). Stochastic goes down, being in the center of its working area, which indicates the possibility of the development of a downward trend in the super short term.
The current readings of technical indicators do not contradict the further development of the “bearish” trend in the near future.
Resistance levels: 0.6885, 0.6920, 0.6968, 0.7000.
Support levels: 0.6843, 0.6815, 0.6780, 0.6748.


Trading tips
Long positions can be opened after a rebound from the level of 0.6843 and a breakout of 0.6860–0.6885 with the target at 0.6968 or 0.7000. Stop loss is 0.6843–0.6830.
Short positions can be opened after the breakdown of 0.6843 with the target at 0.6780 or 0.6748. Stop loss is 0.6875.
Implementation period: 2–3 days.


No comments:
Write comments