AUD/USD: Australian dollar is going down
06 December 2018, 08:32
| Scenario | |
|---|---|
| Timeframe | Intraday |
| Recommendation | BUY STOP |
| Entry Point | 0.7235, 0.7255 |
| Take Profit | 0.7301, 0.7315, 0.7336 |
| Stop Loss | 0.7217, 0.7200 |
| Key Levels | 0.7130, 0.7150, 0.7180, 0.7200, 0.7217, 0.7257, 0.7276, 0.7301, 0.7336 |
| Alternative scenario | |
|---|---|
| Recommendation | SELL STOP |
| Entry Point | 0.7210 |
| Take Profit | 0.7180, 0.7150 |
| Stop Loss | 0.7230, 0.7235 |
| Key Levels | 0.7130, 0.7150, 0.7180, 0.7200, 0.7217, 0.7257, 0.7276, 0.7301, 0.7336 |
Current trend
AUD showed a steady decline against USD on Wednesday, continuing the development of the "bearish" impulse which emerged earlier this week. The pair is declining during today's Asian session, which led to the instrument retreating to local lows of November 27.
AUD is under pressure from poor Q3 GDP data from Australia. The indicator dropped from 0.9% QoQ to 0.3% QoQ and from 3.4% YoY to 2.8% YoY. The decline in the growth rate of the Australian economy was influenced by the trade war between China and the US and the fear of a recession in two of the world's largest economies. Experts also note a reduction in consumer spending by Australian households. The publication of the Australian GDP data has also raised investors' concerns that the RBA could delay the interest rate increase.
Support and resistance
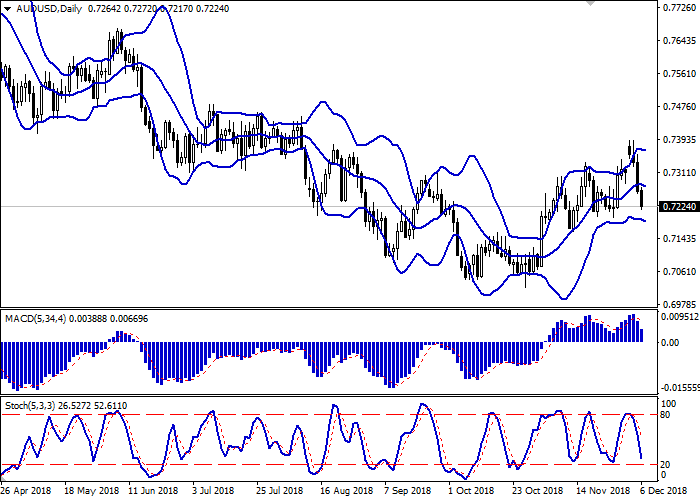
Bollinger Bands in D1 chart demonstrate a gradual decrease. The price range expands from below, reflecting the potential for further development of the downward trend in the short term. MACD is going down keeping a strong sell signal (located below the signal line). Stochastic is declining actively, but approaches its minimum levels, which indicates the risks associated with oversold AUD in the ultra-short term.
Existing short positions should be kept until the situation clears up.
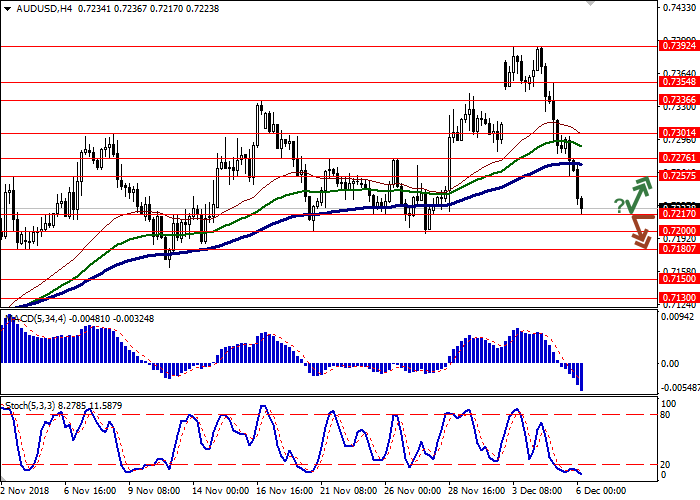
Resistance levels: 0.7257, 0.7276, 0.7301, 0.7336.
Support levels: 0.7217, 0.7200, 0.7180, 0.7150, 0.7130.


Trading tips
To open long positions, one can rely on the rebound from the support level of 0.7217 with the subsequent breakout of 0.7230 or 0.7250. Take profit — 0.7301 or 0.7315, 0.7336. Stop loss — 0.7217 or 0.7200. Implementation period: 2-3 days.
A breakdown of 0.7217 may be a signal to further sales with target at 0.7180 or 0.7150. Stop loss — 0.7230 or 0.7235. Implementation period: 1-2 days.
AUD showed a steady decline against USD on Wednesday, continuing the development of the "bearish" impulse which emerged earlier this week. The pair is declining during today's Asian session, which led to the instrument retreating to local lows of November 27.
AUD is under pressure from poor Q3 GDP data from Australia. The indicator dropped from 0.9% QoQ to 0.3% QoQ and from 3.4% YoY to 2.8% YoY. The decline in the growth rate of the Australian economy was influenced by the trade war between China and the US and the fear of a recession in two of the world's largest economies. Experts also note a reduction in consumer spending by Australian households. The publication of the Australian GDP data has also raised investors' concerns that the RBA could delay the interest rate increase.
Support and resistance
Bollinger Bands in D1 chart demonstrate a gradual decrease. The price range expands from below, reflecting the potential for further development of the downward trend in the short term. MACD is going down keeping a strong sell signal (located below the signal line). Stochastic is declining actively, but approaches its minimum levels, which indicates the risks associated with oversold AUD in the ultra-short term.
Existing short positions should be kept until the situation clears up.
Resistance levels: 0.7257, 0.7276, 0.7301, 0.7336.
Support levels: 0.7217, 0.7200, 0.7180, 0.7150, 0.7130.


Trading tips
To open long positions, one can rely on the rebound from the support level of 0.7217 with the subsequent breakout of 0.7230 or 0.7250. Take profit — 0.7301 or 0.7315, 0.7336. Stop loss — 0.7217 or 0.7200. Implementation period: 2-3 days.
A breakdown of 0.7217 may be a signal to further sales with target at 0.7180 or 0.7150. Stop loss — 0.7230 or 0.7235. Implementation period: 1-2 days.


No comments:
Write comments