
USD/CHF: the instrument shows ambiguous dynamics
03 December 2018, 09:23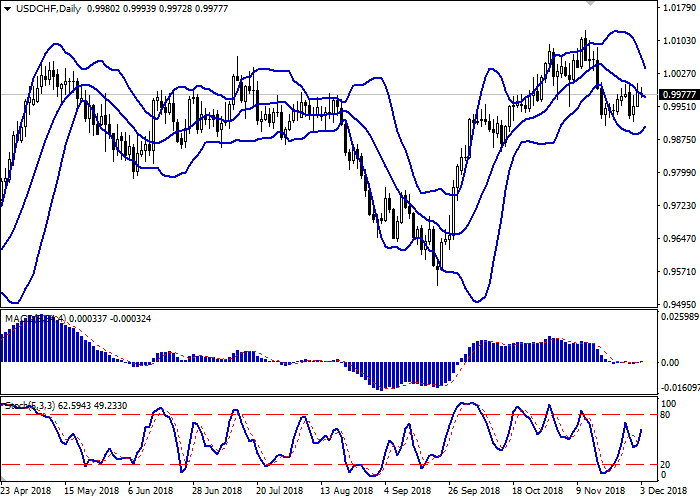
| Scenario | |
|---|---|
| Timeframe | Intraday |
| Recommendation | BUY STOP |
| Entry Point | 1.0005 |
| Take Profit | 1.0050, 1.0073 |
| Stop Loss | 0.9970 |
| Key Levels | 0.9889, 0.9907, 0.9926, 0.9957, 1.0000, 1.0027, 1.0050, 1.0073 |
| Alternative scenario | |
|---|---|
| Recommendation | SELL STOP |
| Entry Point | 0.9950 |
| Take Profit | 0.9907, 0.9900, 0.9889 |
| Stop Loss | 0.9980 |
| Key Levels | 0.9889, 0.9907, 0.9926, 0.9957, 1.0000, 1.0027, 1.0050, 1.0073 |
Current trend
USD resumed its growth against CHF at the end of the last week, recovering to local highs after a rather sharp "bearish" correction in the middle of the week.
USD is supported by expectations of raising the interest rates by the Fed in December. In turn, CHF is under pressure from macroeconomic statistics from Switzerland and eurozone. In November, the Consumer Price Index fell from 2.2% to 2.0%, and the Core Consumer Price Index fell from 1.1% to 1.0%. According to Eurostat, the rise in prices was due to the increase in the cost of energy and food, but the November decline in oil prices could put additional pressure on inflation. CHF was also under pressure from KOF Leading Indicators in Switzerland. In November, the index fell from 100.2 to 99.1 points, which turned out to be worse than forecasts of 99.6 points.
Support and resistance
Bollinger Bands in D1 chart decrease. The price range narrows, reflecting the emergence of ambiguous trading dynamics. MACD is growing, keeping a weak buy signal (located above the signal line). Currently, the indicator is trying to consolidate above the zero level. Stochastic resumed growth after a short correction in the middle of the previous trading week.
Technical indicators do not contradict further development of the "bullish" trend in the short and/or ultra-short term.
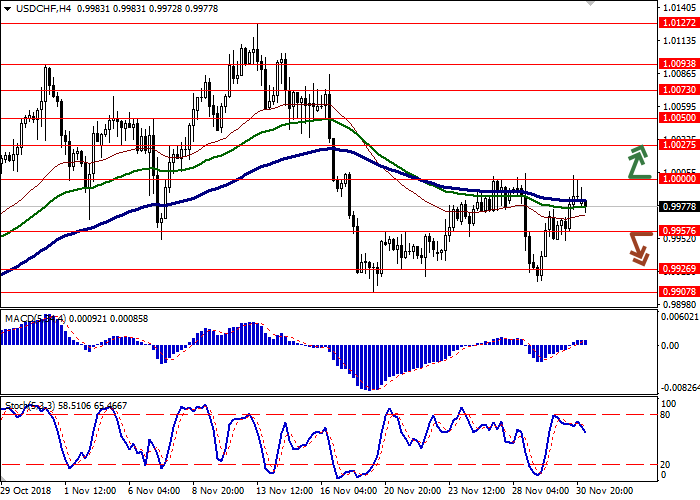
Resistance levels: 1.0000, 1.0027, 1.0050, 1.0073.
Support levels: 0.9957, 0.9926, 0.9907, 0.9889.

Trading tips
To open long positions, one can rely on the breakout of 1.0000. Take profit — 1.0050 or 1.0073. Stop loss – 0.9970.
The return of "bearish" trend with the breakdown of 0.9957 may become a signal for sales with the target at 0.9907, 0.9900 or 0.9889. Stop loss — 0.9980.
Implementation period: 2-3 days.
USD resumed its growth against CHF at the end of the last week, recovering to local highs after a rather sharp "bearish" correction in the middle of the week.
USD is supported by expectations of raising the interest rates by the Fed in December. In turn, CHF is under pressure from macroeconomic statistics from Switzerland and eurozone. In November, the Consumer Price Index fell from 2.2% to 2.0%, and the Core Consumer Price Index fell from 1.1% to 1.0%. According to Eurostat, the rise in prices was due to the increase in the cost of energy and food, but the November decline in oil prices could put additional pressure on inflation. CHF was also under pressure from KOF Leading Indicators in Switzerland. In November, the index fell from 100.2 to 99.1 points, which turned out to be worse than forecasts of 99.6 points.
Support and resistance
Bollinger Bands in D1 chart decrease. The price range narrows, reflecting the emergence of ambiguous trading dynamics. MACD is growing, keeping a weak buy signal (located above the signal line). Currently, the indicator is trying to consolidate above the zero level. Stochastic resumed growth after a short correction in the middle of the previous trading week.
Technical indicators do not contradict further development of the "bullish" trend in the short and/or ultra-short term.
Resistance levels: 1.0000, 1.0027, 1.0050, 1.0073.
Support levels: 0.9957, 0.9926, 0.9907, 0.9889.
Trading tips
To open long positions, one can rely on the breakout of 1.0000. Take profit — 1.0050 or 1.0073. Stop loss – 0.9970.
The return of "bearish" trend with the breakdown of 0.9957 may become a signal for sales with the target at 0.9907, 0.9900 or 0.9889. Stop loss — 0.9980.
Implementation period: 2-3 days.


No comments:
Write comments