
WTI Crude Oil: price restores
03 December 2018, 09:11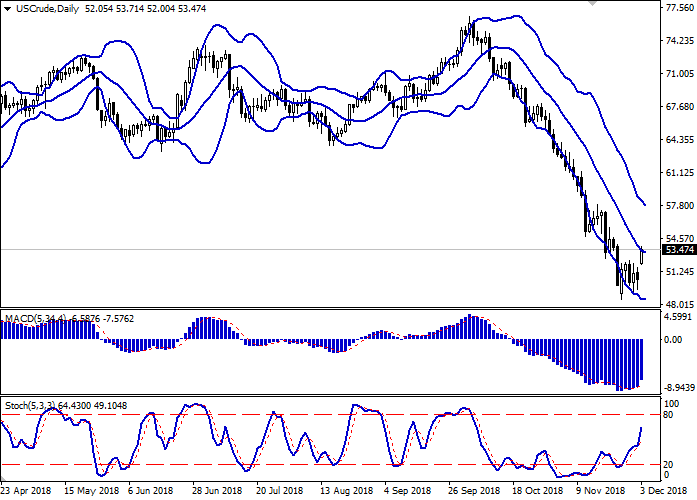
| Scenario | |
|---|---|
| Timeframe | Intraday |
| Recommendation | BUY STOP |
| Entry Point | 54.80 |
| Take Profit | 58.64, 60.00 |
| Stop Loss | 53.40 |
| Key Levels | 48.09, 49.00, 50.00, 51.32, 52.38, 54.72, 55.64, 57.00, 58.64 |
| Alternative scenario | |
|---|---|
| Recommendation | SELL STOP |
| Entry Point | 51.25 |
| Take Profit | 48.09 |
| Stop Loss | 53.50 |
| Key Levels | 48.09, 49.00, 50.00, 51.32, 52.38, 54.72, 55.64, 57.00, 58.64 |
Current trend
Today, during the Asian session, oil prices are steadily growing, opened the trading of the new week with a significant upward gap. Investors are reacting to the results of the G20 summit held at the weekend, at which a key agreement between Russia and Saudi Arabia to lower production volumes was reached. December 6, a meeting of OPEC+ in Vienna will be held, to which market participants will come up with well-formed expectations for next year.
Also noteworthy is the Friday report from Baker Hughes, which reflected the growth in the number of active oil platforms from 885 to 887 units.
Today, investors are waiting for the publication of a block of macroeconomic statistics on US business activity. It is predicted that in November, ISM Manufacturing PMI may increase from 57.7 to 57.8 points, and ISM Manufacturing Prices over the same period may drop from 71.6 to 68.3 points.
Support and resistance
On the daily chart, Bollinger bands are reversing horizontally. The price range narrows, reflecting a sharp change in direction of trading in the short term. MACD indicator is growing, keeping a strong buy signal (the histogram is above the signal line). Stochastic is growing almost vertically, rapidly approaching its highs, which indicates that the instrument may become overbought soon.
The development of the "bullish" trend in the short and/or ultra-short term is possible.
Resistance levels: 54.72, 55.64, 57.00, 58.64.
Support levels: 52.38, 51.32, 50.00, 49.00, 48.09.
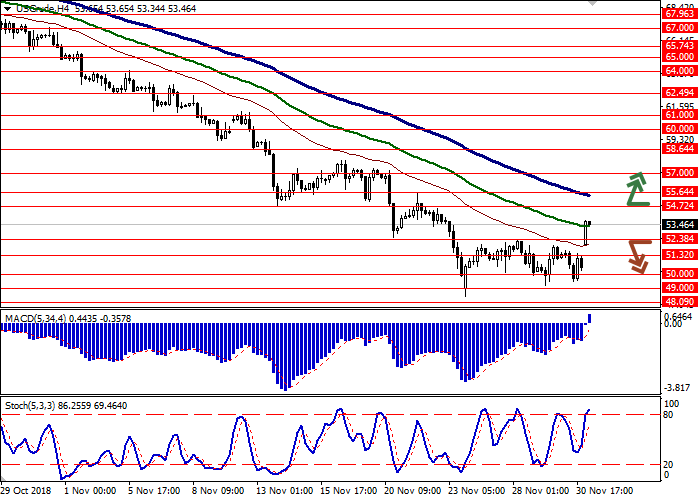

Trading tips
Long positions can be opened after the breakout of the level of 54.72 with the targets at 58.64 or 60.00. Stop loss is 53.40.
Short positions can be opened after the breakdown of the levels of 52.38 or 51.32 with the target at 48.09. Stop loss is 52.40 or 53.50.
Implementation period: 2–3 days.
Today, during the Asian session, oil prices are steadily growing, opened the trading of the new week with a significant upward gap. Investors are reacting to the results of the G20 summit held at the weekend, at which a key agreement between Russia and Saudi Arabia to lower production volumes was reached. December 6, a meeting of OPEC+ in Vienna will be held, to which market participants will come up with well-formed expectations for next year.
Also noteworthy is the Friday report from Baker Hughes, which reflected the growth in the number of active oil platforms from 885 to 887 units.
Today, investors are waiting for the publication of a block of macroeconomic statistics on US business activity. It is predicted that in November, ISM Manufacturing PMI may increase from 57.7 to 57.8 points, and ISM Manufacturing Prices over the same period may drop from 71.6 to 68.3 points.
Support and resistance
On the daily chart, Bollinger bands are reversing horizontally. The price range narrows, reflecting a sharp change in direction of trading in the short term. MACD indicator is growing, keeping a strong buy signal (the histogram is above the signal line). Stochastic is growing almost vertically, rapidly approaching its highs, which indicates that the instrument may become overbought soon.
The development of the "bullish" trend in the short and/or ultra-short term is possible.
Resistance levels: 54.72, 55.64, 57.00, 58.64.
Support levels: 52.38, 51.32, 50.00, 49.00, 48.09.
Trading tips
Long positions can be opened after the breakout of the level of 54.72 with the targets at 58.64 or 60.00. Stop loss is 53.40.
Short positions can be opened after the breakdown of the levels of 52.38 or 51.32 with the target at 48.09. Stop loss is 52.40 or 53.50.
Implementation period: 2–3 days.


No comments:
Write comments