
USD/CHF: the instrument moves horizontally
19 December 2018, 09:08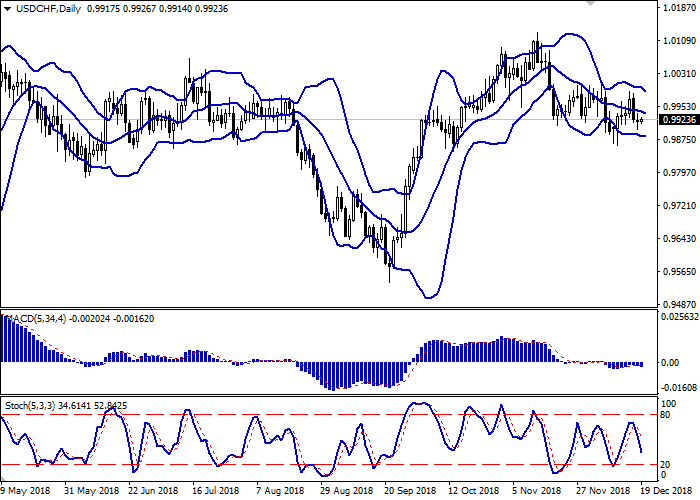
| Scenario | |
|---|---|
| Timeframe | Intraday |
| Recommendation | BUY STOP |
| Entry Point | 0.9940, 0.9960 |
| Take Profit | 1.0000 |
| Stop Loss | 0.9920, 0.9900 |
| Key Levels | 0.9836, 0.9861, 0.9898, 0.9936, 0.9951, 0.9980, 1.0000 |
| Alternative scenario | |
|---|---|
| Recommendation | SELL STOP |
| Entry Point | 0.9890 |
| Take Profit | 0.9836, 0.9820 |
| Stop Loss | 0.9930 |
| Key Levels | 0.9836, 0.9861, 0.9898, 0.9936, 0.9951, 0.9980, 1.0000 |
Current trend
Yesterday, USD moved horizontally against CHF.
The possibility of a coming slowdown in the growth of the Fed’s interest rates affects USD negatively. However, on Tuesday, the US currency was supported by data from American construction market. In November, Building Permits number increased from 1.264 million to 1.328 million, which was much better than the negative forecast of 1.259 million. November Housing Starts indicator also rose from 1.217 to 1.256 million, while the experts forecasted growth only to 1.225 million
CHF is under pressure from the updated SECO Swiss economic outlook: GDP growth in 2018 and 2019 will decline due to weak domestic demand. It is expected that in 2019, GDP will grow by 1.5%, and in 2020 – by 1.7%.
Support and resistance
On the daily chart, Bollinger bands are moderately reducing. The price range narrows from above, reflecting the development of the flat trade dynamics. MACD indicator falls, keeping a weak sell signal (the histogram is below the signal line). Stochastic is falling more actively is rapidly approaching its lows, reflecting that the instrument can become oversold soon.
It is better to wait until the situation is clear.
Resistance levels: 0.9936, 0.9951, 0.9980, 1.0000.
Support levels: 0.9898, 0.9861, 0.9836.
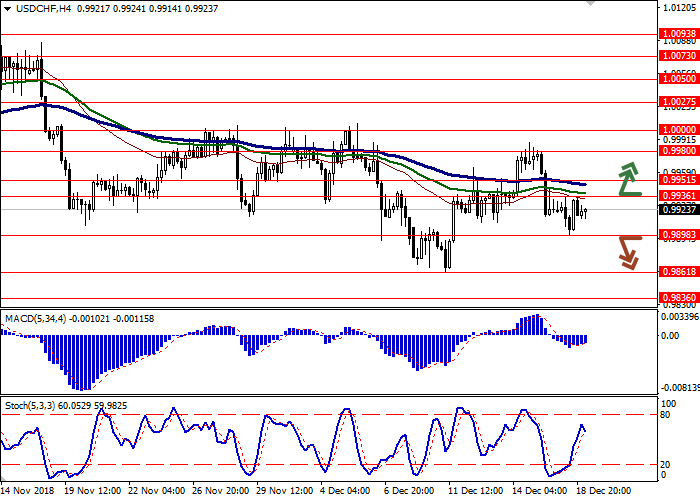

Trading tips
Long positions can be opened after the breakout of the levels of 0.9936–0.9951 with the target at 1.0000. Stop loss is 0.9920–0.9900.
Short positions can be opened after the breakdown of the level of 0.9898 with the targets at 0.9836–0.9820. Stop loss is 0.9930.
Implementation period: 2–3 days.
Yesterday, USD moved horizontally against CHF.
The possibility of a coming slowdown in the growth of the Fed’s interest rates affects USD negatively. However, on Tuesday, the US currency was supported by data from American construction market. In November, Building Permits number increased from 1.264 million to 1.328 million, which was much better than the negative forecast of 1.259 million. November Housing Starts indicator also rose from 1.217 to 1.256 million, while the experts forecasted growth only to 1.225 million
CHF is under pressure from the updated SECO Swiss economic outlook: GDP growth in 2018 and 2019 will decline due to weak domestic demand. It is expected that in 2019, GDP will grow by 1.5%, and in 2020 – by 1.7%.
Support and resistance
On the daily chart, Bollinger bands are moderately reducing. The price range narrows from above, reflecting the development of the flat trade dynamics. MACD indicator falls, keeping a weak sell signal (the histogram is below the signal line). Stochastic is falling more actively is rapidly approaching its lows, reflecting that the instrument can become oversold soon.
It is better to wait until the situation is clear.
Resistance levels: 0.9936, 0.9951, 0.9980, 1.0000.
Support levels: 0.9898, 0.9861, 0.9836.
Trading tips
Long positions can be opened after the breakout of the levels of 0.9936–0.9951 with the target at 1.0000. Stop loss is 0.9920–0.9900.
Short positions can be opened after the breakdown of the level of 0.9898 with the targets at 0.9836–0.9820. Stop loss is 0.9930.
Implementation period: 2–3 days.


No comments:
Write comments