
NZD/USD: New Zealand dollar is falling
20 December 2018, 09:19
| Scenario | |
|---|---|
| Timeframe | Intraday |
| Recommendation | BUY STOP |
| Entry Point | 0.6750, 0.6780 |
| Take Profit | 0.6838, 0.6865, 0.6885 |
| Stop Loss | 0.6730, 0.6710 |
| Key Levels | 0.6571, 0.6609, 0.6662, 0.6704, 0.6748, 0.6776, 0.6815, 0.6838 |
| Alternative scenario | |
|---|---|
| Recommendation | SELL STOP |
| Entry Point | 0.6700 |
| Take Profit | 0.6630, 0.6609, 0.6600 |
| Stop Loss | 0.6750 |
| Key Levels | 0.6571, 0.6609, 0.6662, 0.6704, 0.6748, 0.6776, 0.6815, 0.6838 |
Current trend
Yesterday, NZD fell sharply against USD, renewing the lows since November 27. The strong "bearish" mood was due to the Fed’s interest rate decision and positive US Existing Home Sales statistics.
As expected, the regulator raised the rate by 25 basis points to 2.50%, signaling a slowdown in its growth in the coming year. Existing Home Sales rose unexpectedly by 1.9% MoM in November after rising by 1.4% MoM last month and a negative forecast of –0.6% MoM.
Today, during the Asian session, NZD is falling. The instrument is under pressure from New Zealand's poor GDP data. Q3 indicator grew only by 0.3% QoQ and 2.6% YoY, which was significantly lower than experts' forecasts of +0.6% QoQ and +2.8% YoY.
Support and resistance
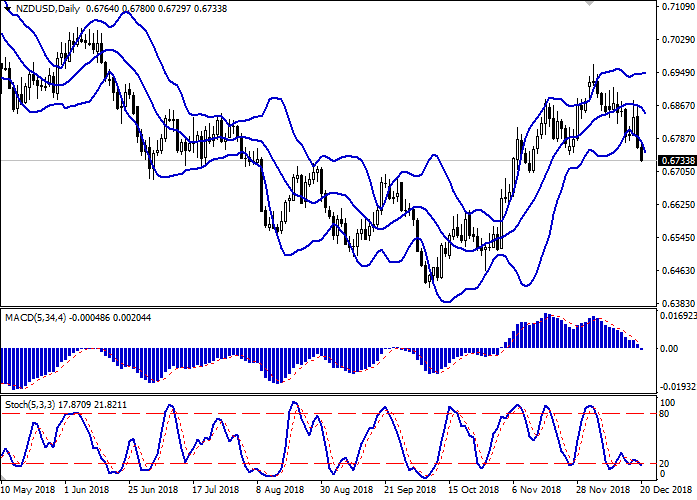
On the daily chart, Bollinger bands reverse horizontally. The price range is widening but not as fast as the "bearish" dynamics is now developing. MACD indicator is falling, keeping a strong sell signal (the histogram is below the signal line), and is trying to consolidate below the zero line. Stochastic is directed downward but it is near its low, which indicates that NZD can become oversold.
It is better to keep current short positions until the market situation becomes clearer.
Resistance levels: 0.6748, 0.6776, 0.6815, 0.6838.
Support levels: 0.6704, 0.6662, 0.6609, 0.6571.
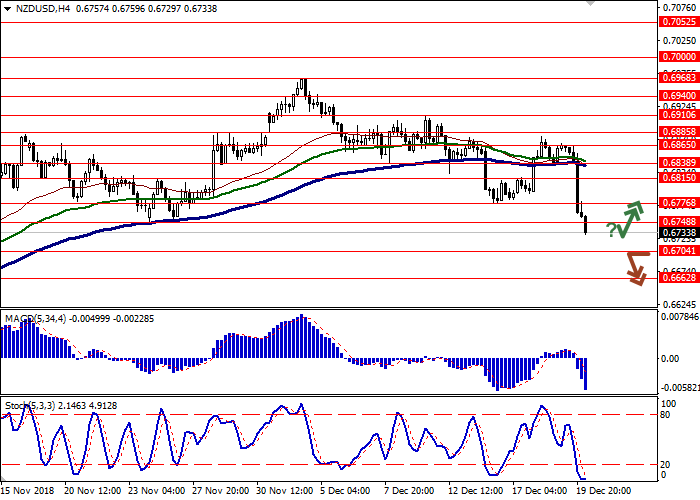
Trading tips
Long positions can be opened after a reversal near the current level and a breakout of 0.6748–0.6776 with the targets at 0.6838 or 0.6865–0.6885. Stop loss is 0.6730–0.6710. Implementation period: 2–3 days.
Short positions can be opened after the breakdown of the level of 0.6704 with the targets at 0.6630 or 0.6609–0.6600. Stop loss is 0.6750. Implementation period: 1–2 days.
Yesterday, NZD fell sharply against USD, renewing the lows since November 27. The strong "bearish" mood was due to the Fed’s interest rate decision and positive US Existing Home Sales statistics.
As expected, the regulator raised the rate by 25 basis points to 2.50%, signaling a slowdown in its growth in the coming year. Existing Home Sales rose unexpectedly by 1.9% MoM in November after rising by 1.4% MoM last month and a negative forecast of –0.6% MoM.
Today, during the Asian session, NZD is falling. The instrument is under pressure from New Zealand's poor GDP data. Q3 indicator grew only by 0.3% QoQ and 2.6% YoY, which was significantly lower than experts' forecasts of +0.6% QoQ and +2.8% YoY.
Support and resistance
On the daily chart, Bollinger bands reverse horizontally. The price range is widening but not as fast as the "bearish" dynamics is now developing. MACD indicator is falling, keeping a strong sell signal (the histogram is below the signal line), and is trying to consolidate below the zero line. Stochastic is directed downward but it is near its low, which indicates that NZD can become oversold.
It is better to keep current short positions until the market situation becomes clearer.
Resistance levels: 0.6748, 0.6776, 0.6815, 0.6838.
Support levels: 0.6704, 0.6662, 0.6609, 0.6571.
Trading tips
Long positions can be opened after a reversal near the current level and a breakout of 0.6748–0.6776 with the targets at 0.6838 or 0.6865–0.6885. Stop loss is 0.6730–0.6710. Implementation period: 2–3 days.
Short positions can be opened after the breakdown of the level of 0.6704 with the targets at 0.6630 or 0.6609–0.6600. Stop loss is 0.6750. Implementation period: 1–2 days.


No comments:
Write comments