
GBP/USD: ambiguous dynamics
20 December 2018, 08:50
| Scenario | |
|---|---|
| Timeframe | Intraday |
| Recommendation | BUY STOP |
| Entry Point | 1.2675 |
| Take Profit | 1.2763, 1.2793 |
| Stop Loss | 1.2620 |
| Key Levels | 1.2476, 1.2533, 1.2574, 1.2600, 1.2670, 1.2722, 1.2763, 1.2793 |
| Alternative scenario | |
|---|---|
| Recommendation | SELL STOP |
| Entry Point | 1.2595 |
| Take Profit | 1.2500, 1.2476 |
| Stop Loss | 1.2650, 1.2660 |
| Key Levels | 1.2476, 1.2533, 1.2574, 1.2600, 1.2670, 1.2722, 1.2763, 1.2793 |
Current trend
Yesterday, GBP fell against USD, despite the fact that during the day the instrument was trading in an upward manner.
Today, British investors are focused on the November poor inflation data. The Consumer Price Index fell from 2.4% to 2.3%, and the Core CPI – from 1.9% to 1.8%, the lowest value since March 2017. The inflation is under pressure of a significant reduction in gasoline and real estate prices, but it was partially balanced by the growth of tobacco prices. Thus, the wage growth in the UK continues to outpace the inflation.
On Thursday, a meeting of the Bank of England with the interest rate decision will be held. It is expected to remain at 0.75%, and members of the regulator will be careful in their comments. Probably, BoE will prefer to refrain from any significant actions until the Brexit ends.
Support and resistance
On the daily chart, Bollinger bands are moderately reducing. The price range is narrowing, reflecting the ambiguous nature of trading in recent days. MACD indicator is growing, keeping a weak buy signal (the histogram is above the signal line). Stochastic reverses into a horizontal plane near the level of 80, which is the formal border of the overbought zone.
It is better to wait until the technical indicators’ signals are clear before opening new positions.
Resistance levels: 1.2670, 1.2722, 1.2763, 1.2793.
Support levels: 1.2600, 1.2574, 1.2533, 1.2476.
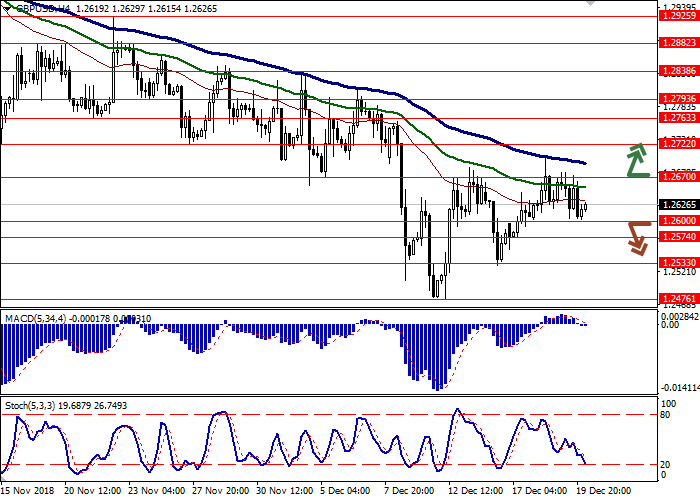

Trading tips
Long positions can be opened after the breakout of the level of 1.2670 with targets at 1.2763–1.2793. Stop loss is 1.2620.
Short positions can be opened after the breakdown of the level of 1.2600 with the target at 1.2500 or 1.2476. Stop loss is 1.2650–1.2660.
Implementation period: 2–3 days.
Yesterday, GBP fell against USD, despite the fact that during the day the instrument was trading in an upward manner.
Today, British investors are focused on the November poor inflation data. The Consumer Price Index fell from 2.4% to 2.3%, and the Core CPI – from 1.9% to 1.8%, the lowest value since March 2017. The inflation is under pressure of a significant reduction in gasoline and real estate prices, but it was partially balanced by the growth of tobacco prices. Thus, the wage growth in the UK continues to outpace the inflation.
On Thursday, a meeting of the Bank of England with the interest rate decision will be held. It is expected to remain at 0.75%, and members of the regulator will be careful in their comments. Probably, BoE will prefer to refrain from any significant actions until the Brexit ends.
Support and resistance
On the daily chart, Bollinger bands are moderately reducing. The price range is narrowing, reflecting the ambiguous nature of trading in recent days. MACD indicator is growing, keeping a weak buy signal (the histogram is above the signal line). Stochastic reverses into a horizontal plane near the level of 80, which is the formal border of the overbought zone.
It is better to wait until the technical indicators’ signals are clear before opening new positions.
Resistance levels: 1.2670, 1.2722, 1.2763, 1.2793.
Support levels: 1.2600, 1.2574, 1.2533, 1.2476.
Trading tips
Long positions can be opened after the breakout of the level of 1.2670 with targets at 1.2763–1.2793. Stop loss is 1.2620.
Short positions can be opened after the breakdown of the level of 1.2600 with the target at 1.2500 or 1.2476. Stop loss is 1.2650–1.2660.
Implementation period: 2–3 days.


No comments:
Write comments