
Brent Crude Oil: general review
19 December 2018, 13:28
| Scenario | |
|---|---|
| Timeframe | Weekly |
| Recommendation | SELL STOP |
| Entry Point | 56.20 |
| Take Profit | 54.68, 50.00 |
| Stop Loss | 57.00 |
| Key Levels | 50.00, 54.68, 56.25, 57.80, 60.00, 62.50 |
| Alternative scenario | |
|---|---|
| Recommendation | BUY STOP |
| Entry Point | 57.55 |
| Take Profit | 60.00, 62.50 |
| Stop Loss | 56.90 |
| Key Levels | 50.00, 54.68, 56.25, 57.80, 60.00, 62.50 |
Current trend
This week, oil prices resumed their decline and fell to the level of 55.80, losing about 7.5%.
Quotes are pressured by known negative factors which are the expectation of growth in oil production and reserves in the USA and investors' doubts that a new reduction under the OPEC+ contract can balance the market. On Monday, the US government published a forecast for domestic oil production; in 2019, it is expected to increase from 10.88 million to 12.06 million barrels per day. US oil reserves also continue to grow: the latest API report recorded an increase of 3.450 million barrels. At the same time, gasoline stocks increased by 1.77 million, and stocks of distillates decreased by 3.44 million barrels.
In the medium term, pressure may weaken, as the low prices already make production unprofitable on some of US shale wells. Baker Hughes' latest data recorded a two-week reduction in the number of rigs, now there're 873. A further reduction may lead to an upward correction.
Support and resistance
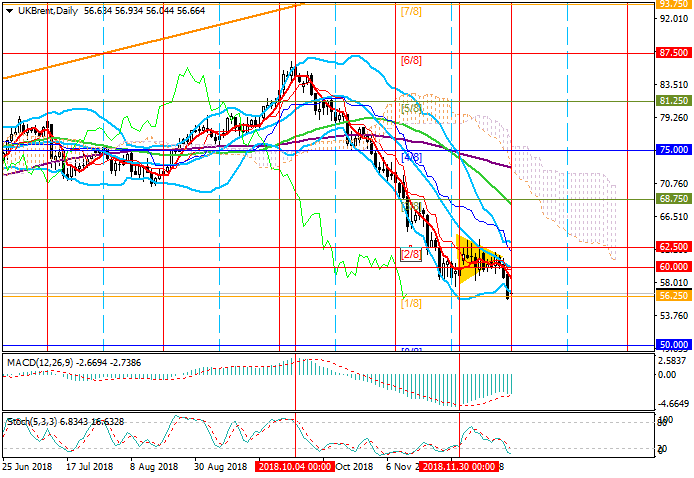
Technically, the price has broken the “triangle” down and is testing 56.25 (Murrey [1/8]); this may lead to a further decrease to 54.68 (Murrey [-2/8], H4) and 50.00 (Murrey [0/8]). Otherwise, correction may resume to the midline of Bollinger Bands at 60.00.
Generally, technical indicators show a continued decline: Bollinger Bands are pointing downwards, MACD histogram is growing in the negative zone, and Stochastic has entered the oversold zone, which makes it possible to correct.
Support levels: 56.25, 54.68, 50.00.
Resistance levels: 57.80, 60.00, 62.50.
Trading tips
Short positions may be opened below 56.25 with targets at 54.68, 50.00 and stop loss at 57.00.
Long positions may be opened above 57.50 with targets at 60.00, 62.50 and stop loss at 56.90.
Implementation period: 4-5 days.
This week, oil prices resumed their decline and fell to the level of 55.80, losing about 7.5%.
Quotes are pressured by known negative factors which are the expectation of growth in oil production and reserves in the USA and investors' doubts that a new reduction under the OPEC+ contract can balance the market. On Monday, the US government published a forecast for domestic oil production; in 2019, it is expected to increase from 10.88 million to 12.06 million barrels per day. US oil reserves also continue to grow: the latest API report recorded an increase of 3.450 million barrels. At the same time, gasoline stocks increased by 1.77 million, and stocks of distillates decreased by 3.44 million barrels.
In the medium term, pressure may weaken, as the low prices already make production unprofitable on some of US shale wells. Baker Hughes' latest data recorded a two-week reduction in the number of rigs, now there're 873. A further reduction may lead to an upward correction.
Support and resistance
Technically, the price has broken the “triangle” down and is testing 56.25 (Murrey [1/8]); this may lead to a further decrease to 54.68 (Murrey [-2/8], H4) and 50.00 (Murrey [0/8]). Otherwise, correction may resume to the midline of Bollinger Bands at 60.00.
Generally, technical indicators show a continued decline: Bollinger Bands are pointing downwards, MACD histogram is growing in the negative zone, and Stochastic has entered the oversold zone, which makes it possible to correct.
Support levels: 56.25, 54.68, 50.00.
Resistance levels: 57.80, 60.00, 62.50.
Trading tips
Short positions may be opened below 56.25 with targets at 54.68, 50.00 and stop loss at 57.00.
Long positions may be opened above 57.50 with targets at 60.00, 62.50 and stop loss at 56.90.
Implementation period: 4-5 days.


No comments:
Write comments