
XAU/USD: gold prices are consolidating
20 December 2018, 08:31
| Scenario | |
|---|---|
| Timeframe | Intraday |
| Recommendation | BUY STOP |
| Entry Point | 1247.10 |
| Take Profit | 1255.00, 1257.82 |
| Stop Loss | 1243.00 |
| Key Levels | 1229.84, 1232.70, 1237.16, 1241.52, 1247.00, 1250.66, 1255.00, 1257.82 |
| Alternative scenario | |
|---|---|
| Recommendation | SELL STOP |
| Entry Point | 1241.45 |
| Take Profit | 1232.70, 1229.84 |
| Stop Loss | 1245.00 |
| Key Levels | 1229.84, 1232.70, 1237.16, 1241.52, 1247.00, 1250.66, 1255.00, 1257.82 |
Current trend
Gold prices showed a decline on Wednesday, but during the day the instrument traded with an increase and even managed to update the record highs of July 10 2018. The reason for the appearance of the "bearish" dynamics was the expected decision of the Fed to raise interest rates.
Nevertheless, the regulator noted that the rate of future increases will decrease. At the moment, 11 out of 17 Fed officials are expecting only two rate increases in 2019.
Meanwhile, US-Chinese trade negotiations continue to move forward and apparently are successful. On Tuesday, the US Treasury Secretary Stephen Mnuchin said that the representatives of the countries intend to meet in January to discuss the extension of the truce. He also noted that the parties are striving to conclude a specific agreement, where the details and terms of the execution of the deal will be clearly stated.
Support and resistance
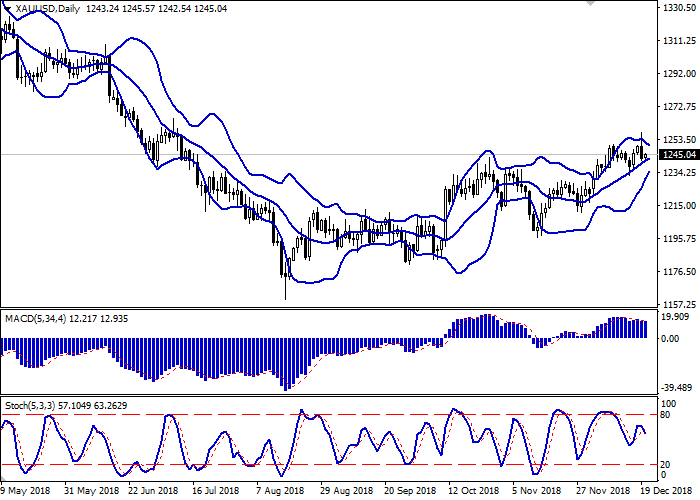
In the D1 chart Bollinger Bands demonstrate active growth, keeping a tendency to reversal into a horizontal plane. The price range is rapidly narrowing, reflecting ambiguous dynamics of trading in the short term. MACD is declining keeping a weak sell signal (located below the signal line). Stochastic also reverses downwards after a short-time increase at the beginning of the week.
It is worth looking into the possibility of the downward correction in the short and/or ultra-short term.
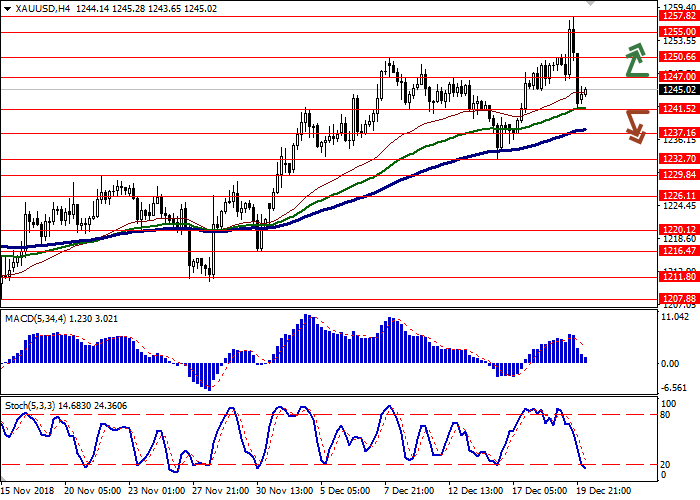
Resistance levels: 1247.00, 1250.66, 1255.00, 1257.82.
Support levels: 1241.52, 1237.16, 1232.70, 1229.84.
Trading tips
To open long positions, one can rely on the breakout of 1247.00. Take profit — 1255.00 or 1257.82. Stop loss — 1243.00. Implementation period: 1-2 days.
A breakdown of 1241.52 may be a signal to further sales with target at 1232.70 or 1229.84. Stop loss — 1245.00. Implementation period: 2-3 days.
Gold prices showed a decline on Wednesday, but during the day the instrument traded with an increase and even managed to update the record highs of July 10 2018. The reason for the appearance of the "bearish" dynamics was the expected decision of the Fed to raise interest rates.
Nevertheless, the regulator noted that the rate of future increases will decrease. At the moment, 11 out of 17 Fed officials are expecting only two rate increases in 2019.
Meanwhile, US-Chinese trade negotiations continue to move forward and apparently are successful. On Tuesday, the US Treasury Secretary Stephen Mnuchin said that the representatives of the countries intend to meet in January to discuss the extension of the truce. He also noted that the parties are striving to conclude a specific agreement, where the details and terms of the execution of the deal will be clearly stated.
Support and resistance
In the D1 chart Bollinger Bands demonstrate active growth, keeping a tendency to reversal into a horizontal plane. The price range is rapidly narrowing, reflecting ambiguous dynamics of trading in the short term. MACD is declining keeping a weak sell signal (located below the signal line). Stochastic also reverses downwards after a short-time increase at the beginning of the week.
It is worth looking into the possibility of the downward correction in the short and/or ultra-short term.
Resistance levels: 1247.00, 1250.66, 1255.00, 1257.82.
Support levels: 1241.52, 1237.16, 1232.70, 1229.84.
Trading tips
To open long positions, one can rely on the breakout of 1247.00. Take profit — 1255.00 or 1257.82. Stop loss — 1243.00. Implementation period: 1-2 days.
A breakdown of 1241.52 may be a signal to further sales with target at 1232.70 or 1229.84. Stop loss — 1245.00. Implementation period: 2-3 days.


No comments:
Write comments