
AUD/USD: AUD shows ambiguous dynamics
17 December 2018, 08:26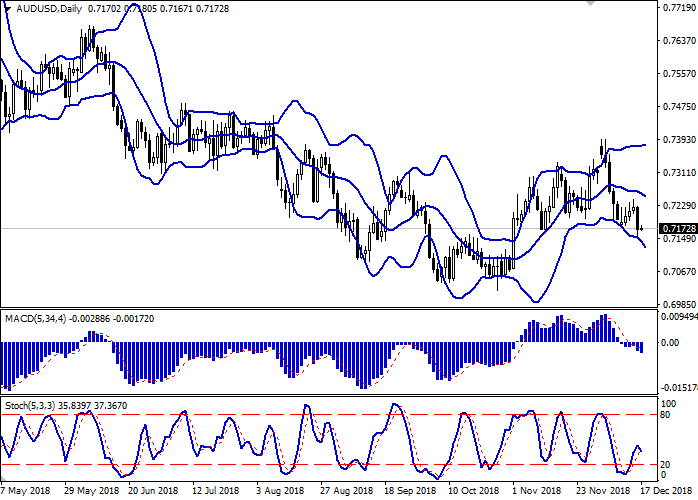
| Scenario | |
|---|---|
| Timeframe | Intraday |
| Recommendation | BUY STOP |
| Entry Point | 0.7205 |
| Take Profit | 0.7257, 0.7261, 0.7301 |
| Stop Loss | 0.7170 |
| Key Levels | 0.7105, 0.7130, 0.7150, 0.7200, 0.7229, 0.7257, 0.7276 |
| Alternative scenario | |
|---|---|
| Recommendation | SELL STOP |
| Entry Point | 0.7145 |
| Take Profit | 0.7105 |
| Stop Loss | 0.7175 |
| Key Levels | 0.7105, 0.7130, 0.7150, 0.7200, 0.7229, 0.7257, 0.7276 |
Current trend
AUD showed a steady decline against USD last Friday, updating local lows of November 1 and leveling out all attempts of the instrument to increase last week.
The traders are focused on US-China trade conflict. On Friday it became known that starting from January 1 the Chinese authorities will cancel the additional 25% duty on imports of American cars and spare parts to them. This step was taken as part of the truce negotiated by Xi Jinping and Donald Trump at the last G20 meeting. Cancellation of fees is temporary and will last for three months. For the same period the US administration will refrain from increasing the import tariffs on Chinese exports totaling USD 200 billion from 10% to 25%.
Retail sales statistics published in the US on Friday gave additional support to USD. In November, the indicator rose by 0.9% MoM after rising by 0.7%, while the forecast was +0.4%.
Support and resistance
Bollinger Bands in D1 chart demonstrate a gradual decrease. The price range expands, making way to new local lows for the "bears". MACD is going down keeping a fairly stable sell signal (located below the signal line). Stochastic is reversing downwards again after a brief increase last week.
Technical indicators do not contradict the further development of the "bearish" trend in the short and/or ultra-short term.
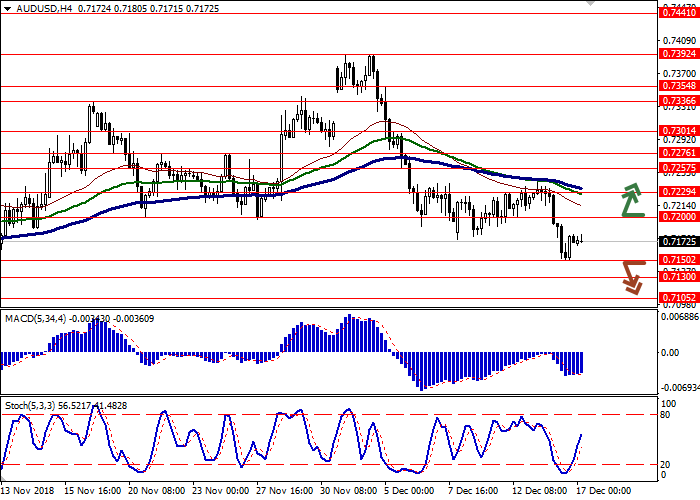
Resistance levels: 0.7200, 0.7229, 0.7257, 0.7276.
Support levels: 0.7150, 0.7130, 0.7105.

Trading tips
To open long positions, one can rely on the breakout of 0.7200. Take profit — 0.7257, 0.7261 or 0.7301. Stop loss — 0.7170. Implementation period: 2-3 days.
The return of "bearish" trend with the breakdown of 0.7150 may become a signal for new sales with the target at 0.7105. Stop loss — 0.7175. Implementation period: 1-2 days.
AUD showed a steady decline against USD last Friday, updating local lows of November 1 and leveling out all attempts of the instrument to increase last week.
The traders are focused on US-China trade conflict. On Friday it became known that starting from January 1 the Chinese authorities will cancel the additional 25% duty on imports of American cars and spare parts to them. This step was taken as part of the truce negotiated by Xi Jinping and Donald Trump at the last G20 meeting. Cancellation of fees is temporary and will last for three months. For the same period the US administration will refrain from increasing the import tariffs on Chinese exports totaling USD 200 billion from 10% to 25%.
Retail sales statistics published in the US on Friday gave additional support to USD. In November, the indicator rose by 0.9% MoM after rising by 0.7%, while the forecast was +0.4%.
Support and resistance
Bollinger Bands in D1 chart demonstrate a gradual decrease. The price range expands, making way to new local lows for the "bears". MACD is going down keeping a fairly stable sell signal (located below the signal line). Stochastic is reversing downwards again after a brief increase last week.
Technical indicators do not contradict the further development of the "bearish" trend in the short and/or ultra-short term.
Resistance levels: 0.7200, 0.7229, 0.7257, 0.7276.
Support levels: 0.7150, 0.7130, 0.7105.
Trading tips
To open long positions, one can rely on the breakout of 0.7200. Take profit — 0.7257, 0.7261 or 0.7301. Stop loss — 0.7170. Implementation period: 2-3 days.
The return of "bearish" trend with the breakdown of 0.7150 may become a signal for new sales with the target at 0.7105. Stop loss — 0.7175. Implementation period: 1-2 days.


No comments:
Write comments