
XAG/USD: silver prices are going down
17 December 2018, 09:24
| Scenario | |
|---|---|
| Timeframe | Intraday |
| Recommendation | BUY |
| Entry Point | 14.60 |
| Take Profit | 14.78 |
| Stop Loss | 14.45 |
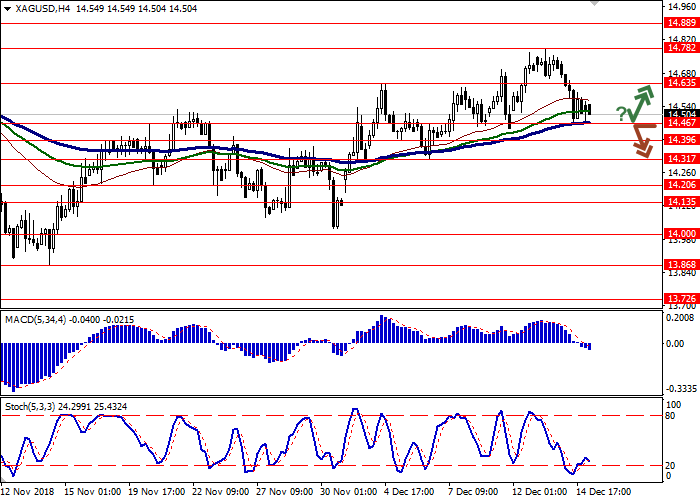
| Key Levels | 14.13, 14.20, 14.31, 14.39, 14.46, 14.63, 14.78, 14.88, 15.00 |
| Alternative scenario | |
|---|---|
| Recommendation | SELL STOP |
| Entry Point | 14.44, 14.37 |
| Take Profit | 14.20, 14.13 |
| Stop Loss | 14.60 |
| Key Levels | 14.13, 14.20, 14.31, 14.39, 14.46, 14.63, 14.78, 14.88, 15.00 |
Current trend
Silver prices returned to active decline last Friday. A certain pressure on the instrument was exerted by the data on retail sales in the US for November, published at the end of the week.
As expected, in November, the sales index slowed down from +1.1% MoM to +0.2% MoM. At the same time, the Retail Control, an indicator published by the US Census Bureau, unexpectedly rose from +0.7% MoM to +0.9% MoM in November.
The growth of optimism in the USD was supported by Industrial Production published in US. The indicator grew by 0.6% MoM in November after the decline by 0.2% MoM a month earlier. Analysts had expected growth by 0.3% MoM only.
Support and resistance
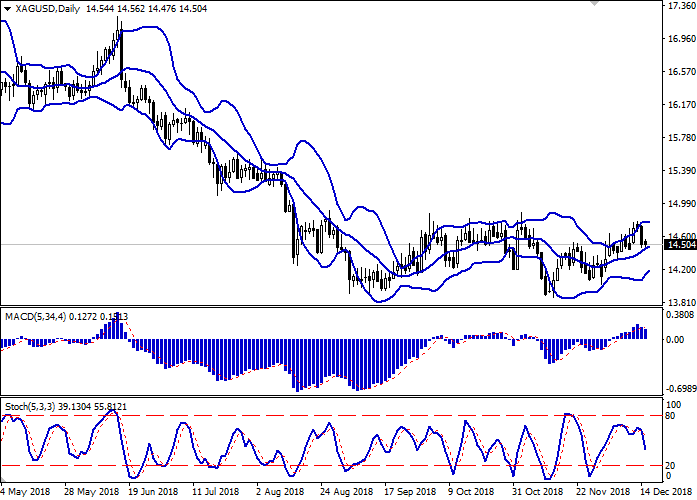
In the D1 chart, Bollinger Bands are reversing horizontally. The price range is narrowing, reflecting the appearance of the flat dynamics in recent days. MACD is going down keeping a moderate sell signal (located below the signal line). Stochastic has reversed to decline sharply and currently it is rapidly approaching its minimum levels, which indicates the growing risks of silver being oversold.
Existing short positions should be kept until the situation clears up.
Resistance levels: 14.63, 14.78, 14.88, 15.00.
Support levels: 14.46, 14.39, 14.31, 14.20, 14.13.
Trading tips
To open long positions, one can rely on the rebound from the support level of 14.46 with the subsequent breakout of 14.55. Take profit — 14.78. Stop loss — 14.40.
A breakdown of 14.46 or 14.39 may be a signal to further sales with target at 14.20 or 14.13. Stop loss — 14.50 or 14.60.
Implementation period: 2-3 days.
Silver prices returned to active decline last Friday. A certain pressure on the instrument was exerted by the data on retail sales in the US for November, published at the end of the week.
As expected, in November, the sales index slowed down from +1.1% MoM to +0.2% MoM. At the same time, the Retail Control, an indicator published by the US Census Bureau, unexpectedly rose from +0.7% MoM to +0.9% MoM in November.
The growth of optimism in the USD was supported by Industrial Production published in US. The indicator grew by 0.6% MoM in November after the decline by 0.2% MoM a month earlier. Analysts had expected growth by 0.3% MoM only.
Support and resistance
In the D1 chart, Bollinger Bands are reversing horizontally. The price range is narrowing, reflecting the appearance of the flat dynamics in recent days. MACD is going down keeping a moderate sell signal (located below the signal line). Stochastic has reversed to decline sharply and currently it is rapidly approaching its minimum levels, which indicates the growing risks of silver being oversold.
Existing short positions should be kept until the situation clears up.
Resistance levels: 14.63, 14.78, 14.88, 15.00.
Support levels: 14.46, 14.39, 14.31, 14.20, 14.13.
Trading tips
To open long positions, one can rely on the rebound from the support level of 14.46 with the subsequent breakout of 14.55. Take profit — 14.78. Stop loss — 14.40.
A breakdown of 14.46 or 14.39 may be a signal to further sales with target at 14.20 or 14.13. Stop loss — 14.50 or 14.60.
Implementation period: 2-3 days.


No comments:
Write comments