
USD/CAD: the pair keeps the upward momentum
30 November 2018, 09:40
| Scenario | |
|---|---|
| Timeframe | Intraday |
| Recommendation | BUY STOP |
| Entry Point | 1.3305, 1.3320 |
| Take Profit | 1.3358, 1.3384, 1.3400 |
| Stop Loss | 1.3280, 1.3264 |
| Key Levels | 1.3169, 1.3200, 1.3241,1.3264, 1.3300, 1.3317, 1.3358, 1.3384 |
| Alternative scenario | |
|---|---|
| Recommendation | SELL STOP |
| Entry Point | 1.3260, 1.3235 |
| Take Profit | 1.3200, 1.3169, 1.3150 |
| Stop Loss | 1.3270, 1.3300 |
| Key Levels | 1.3169, 1.3200, 1.3241,1.3264, 1.3300, 1.3317, 1.3358, 1.3384 |
Current trend
Yesterday, USD moved horizontally against CAD, ending the daily session with almost zero results. Today, during the Asian session, the USD/CAD pair is growing, awaiting the appearance of new drivers in the market.
On Thursday, USD was under pressure of poor macroeconomic statistics of the country. Thus, October Personal Consumption grew by only 0.1% MoM after rising by 0.2% MoM last month. Analysts had expected the growth by +0.2% MoM. In annual terms, the index growth slowed from +1.9% YoY to +1.8%, which also was worse than market forecasts. Initial Jobless Claims increased from 224 to 234K, contrary to forecasts of a decline to 220K.
Today, investors expect the publication of the October block of statistics on price indices for raw materials and industrial products of Canada and the release of annual data on Canadian GDP for the 3rd quarter.
Support and resistance
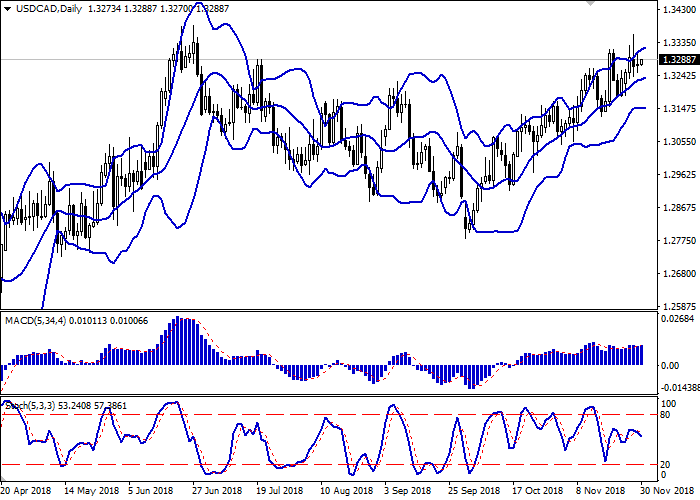
On the daily chart, Bollinger bands reverse horizontally. The price range widens above, letting the “bulls” renew local highs. MACD indicator is growing, keeping a weak buy signal (the histogram is above the signal line). Stochastic is hovering at the center of its work area.
It is better to wait until the situation is clear.
Resistance levels: 1.3300, 1.3317, 1.3358, 1.3384.
Support levels: 1.3264, 1.3241, 1.3200, 1.3169.
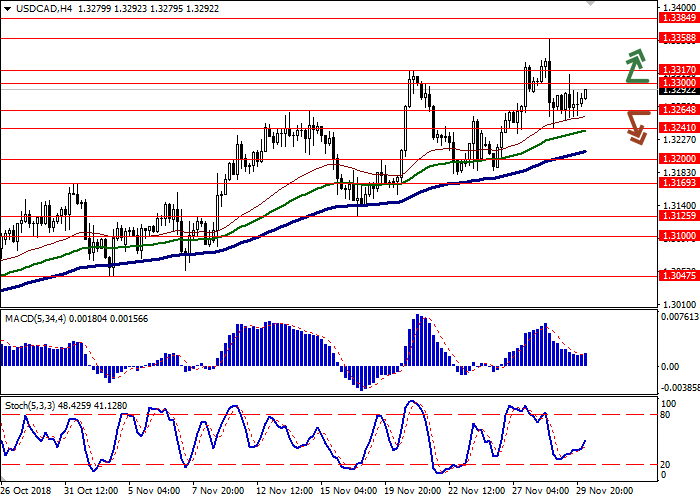
Trading tips
Long positions can be opened after the breakout of the level of 1.3300 or 1.3317 with the targets at 1.3358 or 1.3384–1.3400. Stop loss is 1.3280–1.3264.
Short positions can be opened after the breakdown of the levels of 1.3264–1.3241 with the targets at 1.3200 or 1.3169–1.3150. Stop loss is 1.3270 or 1.3300.
Implementation period: 2–3 days.
Yesterday, USD moved horizontally against CAD, ending the daily session with almost zero results. Today, during the Asian session, the USD/CAD pair is growing, awaiting the appearance of new drivers in the market.
On Thursday, USD was under pressure of poor macroeconomic statistics of the country. Thus, October Personal Consumption grew by only 0.1% MoM after rising by 0.2% MoM last month. Analysts had expected the growth by +0.2% MoM. In annual terms, the index growth slowed from +1.9% YoY to +1.8%, which also was worse than market forecasts. Initial Jobless Claims increased from 224 to 234K, contrary to forecasts of a decline to 220K.
Today, investors expect the publication of the October block of statistics on price indices for raw materials and industrial products of Canada and the release of annual data on Canadian GDP for the 3rd quarter.
Support and resistance
On the daily chart, Bollinger bands reverse horizontally. The price range widens above, letting the “bulls” renew local highs. MACD indicator is growing, keeping a weak buy signal (the histogram is above the signal line). Stochastic is hovering at the center of its work area.
It is better to wait until the situation is clear.
Resistance levels: 1.3300, 1.3317, 1.3358, 1.3384.
Support levels: 1.3264, 1.3241, 1.3200, 1.3169.
Trading tips
Long positions can be opened after the breakout of the level of 1.3300 or 1.3317 with the targets at 1.3358 or 1.3384–1.3400. Stop loss is 1.3280–1.3264.
Short positions can be opened after the breakdown of the levels of 1.3264–1.3241 with the targets at 1.3200 or 1.3169–1.3150. Stop loss is 1.3270 or 1.3300.
Implementation period: 2–3 days.


No comments:
Write comments