
USD/JPY: the dollar is dropping
30 November 2018, 09:28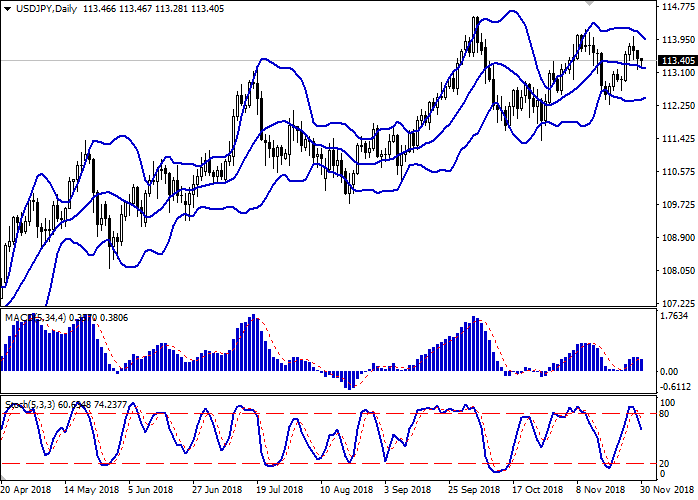
| Scenario | |
|---|---|
| Timeframe | Intraday |
| Recommendation | BUY STOP |
| Entry Point | 113.70 |
| Take Profit | 114.07, 114.30 |
| Stop Loss | 113.37 |
| Key Levels | 112.65, 113.00, 113.18, 113.37, 113.64, 113.83, 114.07, 114.30 |
| Alternative scenario | |
|---|---|
| Recommendation | SELL STOP |
| Entry Point | 113.10, 112.95 |
| Take Profit | 112.40, 112.29 |
| Stop Loss | 113.25, 113.45 |
| Key Levels | 112.65, 113.00, 113.18, 113.37, 113.64, 113.83, 114.07, 114.30 |
Current trend
USD showed a rather active decline against JPY on Thursday. However, the instrument failed to keep its positions, and by the moment of closing of the daily session it had regained half of its losses.
On Thursday, JPY was supported by growth in retail sales in Japan. In October, the figure rose from 2.2% to 3.5% (the most significant growth since last December). Purchases of fuel, cars, drugs, and cosmetics have increased. The increase in retail sales encourages investors because it is pushing GDP growth. The Japanese economy is expected to resume growth after a 1.2% decline in Q3.
Today, the pair is trading in both directions Investors are focused on the statistics on Tokyo CPI. The indicator grew by 0.8% YoY in November after the decline by 1.5% YoY in the previous month. Tokyo Core CPI remained at +1% YoY.
Support and resistance
Bollinger Bands in D1 chart demonstrate flat dynamics. The price range is actively narrowing, reacting to the emergence of "bearish" trend in the short term. MACD is declining keeping a weak sell signal (located below the signal line). Stochastic demonstrates a similar dynamics, retreating from its maximum values.
Technical indicators do not contradict the further development of the "bearish" trend in the short and/or ultra-short term.
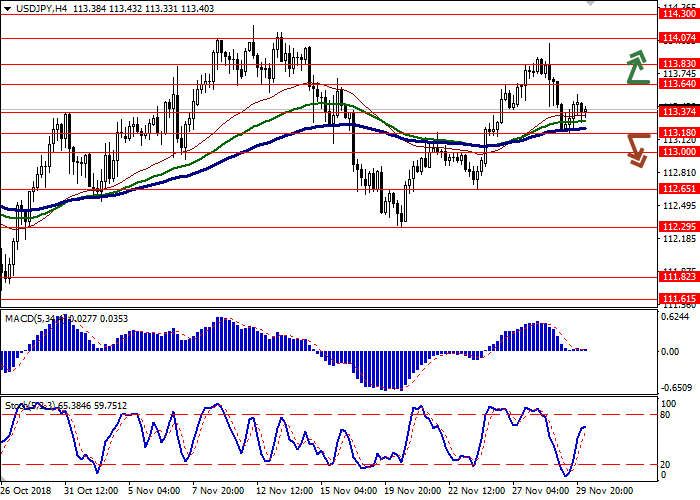
Resistance levels: 113.64, 113.83, 114.07, 114.30.
Support levels: 113.37, 113.18, 113.00, 112.65.

Trading tips
To open long positions, one can rely on the breakout of 113.64. Take profit — 114.07 or 114.30. Stop loss — 113.37.
A confident breakdown of 113.18 or 113.00 may be a signal to further sales with target at 112.40 or 112.29. Stop loss — 113.25 or 113.45.
Implementation period: 2-3 days.
USD showed a rather active decline against JPY on Thursday. However, the instrument failed to keep its positions, and by the moment of closing of the daily session it had regained half of its losses.
On Thursday, JPY was supported by growth in retail sales in Japan. In October, the figure rose from 2.2% to 3.5% (the most significant growth since last December). Purchases of fuel, cars, drugs, and cosmetics have increased. The increase in retail sales encourages investors because it is pushing GDP growth. The Japanese economy is expected to resume growth after a 1.2% decline in Q3.
Today, the pair is trading in both directions Investors are focused on the statistics on Tokyo CPI. The indicator grew by 0.8% YoY in November after the decline by 1.5% YoY in the previous month. Tokyo Core CPI remained at +1% YoY.
Support and resistance
Bollinger Bands in D1 chart demonstrate flat dynamics. The price range is actively narrowing, reacting to the emergence of "bearish" trend in the short term. MACD is declining keeping a weak sell signal (located below the signal line). Stochastic demonstrates a similar dynamics, retreating from its maximum values.
Technical indicators do not contradict the further development of the "bearish" trend in the short and/or ultra-short term.
Resistance levels: 113.64, 113.83, 114.07, 114.30.
Support levels: 113.37, 113.18, 113.00, 112.65.
Trading tips
To open long positions, one can rely on the breakout of 113.64. Take profit — 114.07 or 114.30. Stop loss — 113.37.
A confident breakdown of 113.18 or 113.00 may be a signal to further sales with target at 112.40 or 112.29. Stop loss — 113.25 or 113.45.
Implementation period: 2-3 days.


No comments:
Write comments